|
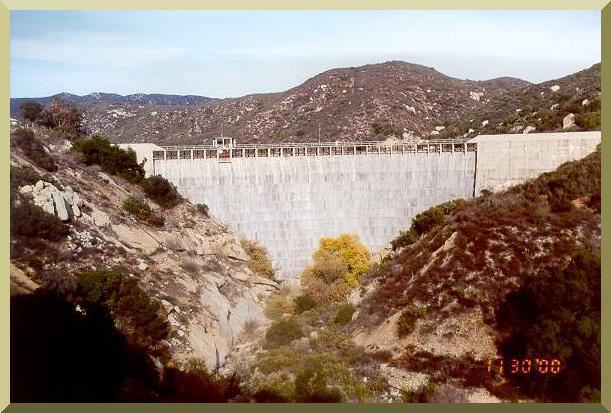
| Barrett Dam in Cottonwood Creek (40109). |

|
| Barrett Dam in Cottonwood Creek (40109). |
| Table B-7. Functions of elevation - stored volume - spilled discharge for Barrett reservoir.1 |
| Relative level (ft) | Absolute level (ft) |
Volumen stored (acre-ft) | Spilled discharge (ft3/s) | Absolute level (m) |
Stored volume (m3) |
Spilled discharge (m3/s) |
| 115.0 | 1561.1 | 11023. | 0. | 475.823 | 13596670. | 0.00 |
| 118.0 | 1564.1 | 12175. | 0. | 476.738 | 15017641. | 0.00 |
| 121.0 | 1567.1 | 13401. | 0. | 477.652 | 16529890. | 0.00 |
| 124.0 | 1570.1 | 14703. | 0. | 478.566 | 18135884. | 0.00 |
| 127.0 | 1573.1 | 16088. | 0. | 479.481 | 19844256. | 0.00 |
| 130.0 | 1576.1 | 17565. | 0. | 480.395 | 21666108. | 0.00 |
| 133.0 | 1579.1 | 19137. | 0. | 481.310 | 23605142. | 0.00 |
| 136.0 | 1582.1 | 20802. | 0. | 482.224 | 25658888. | 0.00 |
| 139.0 | 1585.1 | 22553. | 0. | 483.138 | 27818716. | 0.00 |
| 142.0 | 1588.1 | 24388. | 0. | 484.053 | 30082154. | 0.00 |
| 145.0 | 1591.1 | 26308. | 0. | 484.967 | 32450440. | 0.00 |
| 148.0 | 1594.1 | 28315. | 0. | 485.882 | 34926036. | 0.00 |
| 151.0 | 1597.1 | 30411. | 0. | 486.796 | 37511416. | 0.00 |
| 154.0 | 1600.1 | 32597. | 0. | 487.710 | 40207808. | 0.00 |
| 157.0 | 1603.1 | 34872. | 0. | 488.625 | 43013976. | 0.00 |
| 160.0 | 1606.1 | 37236. | 0. | 489.539 | 45929928. | 0.00 |
| 160.9 | 1607.0 | 37955. | 0. | 489.814 | 46816804. | 0.00 |
| 161.0 | 1607.1 | 38044. | 39. | 489.844 | 46926584. | 1.10 |
| 162.0 | 1608.1 | 38861. | 1407. | 490.149 | 47934336. | 39.84 |
| 163.0 | 1609.1 | 39688. | 3712. | 490.454 | 48954428. | 105.11 |
| 164.0 | 1610.1 | 40525. | 6380. | 490.758 | 49986852. | 180.66 |
| 165.0 | 1611.1 | 41373. | 9388. | 491.063 | 51032844. | 265.84 |
| 166.0 | 1612.1 | 42230. | 13218. | 491.368 | 52089936. | 374.29 |
| 167.0 | 1613.1 | 43097. | 17029. | 491.673 | 53159364. | 482.21 |
| 168.0 | 1614.1 | 43974. | 21318. | 491.978 | 54241128. | 603.66 |
| 169.0 | 1615.1 | 44861. | 25735. | 492.282 | 55335228. | 728.73 |
| 170.0 | 1616.1 | 45759. | 30438. | 492.587 | 56442896. | 861.91 |
| 171.0 | 1617.1 | 46667. | 35596. | 492.892 | 57562896. | 1007.96 |
| 172.0 | 1618.1 | 47585. | 41187. | 493.197 | 58695232. | 1166.28 |
| 173.0 | 1619.1 | 48513. | 47148. | 493.502 | 59839904. | 1335.08 |
| 174.0 | 1620.1 | 49451. | 53432. | 493.806 | 60996908. | 1513.02 |
| 175.0 | 1621.1 | 50500. | 60013. | 494.111 | 62290832. | 1699.38 |
| 176.0 | 1622.1 | 51550. | 66874. | 494.416 | 63585988. | 1893.66 |
| 177.0 | 1623.1 | 52610. | 74001. | 494.721 | 64893480. | 2095.47 |
| 178.0 | 1624.1 | 53680. | 81384. | 495.026 | 66213304. | 2304.53 |
| 179.0 | 1625.1 | 54751. | 89012. | 495.330 | 67534360. | 2520.53 |
| 1
The data in the first four columns was supplied by the Water Department of the City of San Diego.
|