|
| |
Climatological gradient in the Loja valley,Loja province, Ecuador
08 November 2014
|
|
ABSTRACT
Mean annual precipitation and mean annual temperature along the Loja valley, Ecuador,
have been calculated using data from seven (7) climatological stations, six (6) of them operated by the
Universidad Técnica Particular de Loja (Private Technical University of Loja), and one (1)
by the Instituto Nacional de Meteorologia e Hidrologia.
The results show a definite gradient of mean annual precipitation in the north-south direction.
Mean annual precipitation varies from 900 mm toward the northern limit of the valley
to 1400 mm near the southern limit. The difference is attributed to
the higher elevation of Cajanuma Knot to the south,
as compared to that of Guagra-uma Knot to the north.
Mean annual precipitation along the valley's center averages 900 mm, while
mean annual temperature is around 16°C. Both of these values are judged to be near optimal
from the standpoint of biotic potential.
|
1. INTRODUCTION
The city of Loja is the capital of Loja province, in Ecuador.
The city is located near the center of the Catamayo-Zamora transect, where
ecohydroclimatological research is being conducted by the authors
(Ponce and Oñate-Valdivieso, 2014).
Mean annual precipitation varies between 400 mm in Catamayo, to the west, and 2200 mm near Zamora, to the east.
The city of Loja occupies the narrow valley of Loja, between the Guagra-uma knot to the north
and the Cajanuma knot to the south (Fig. 1) (Wolf, 1892).
|
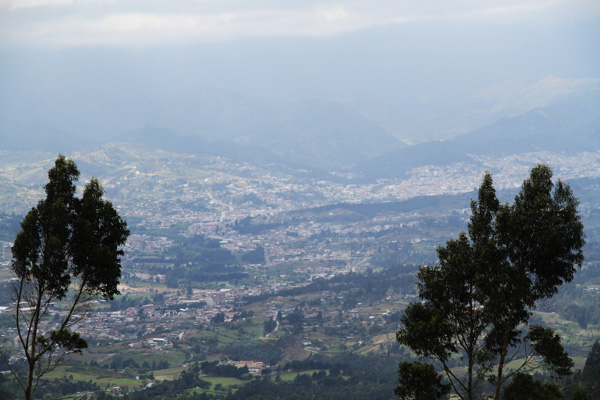
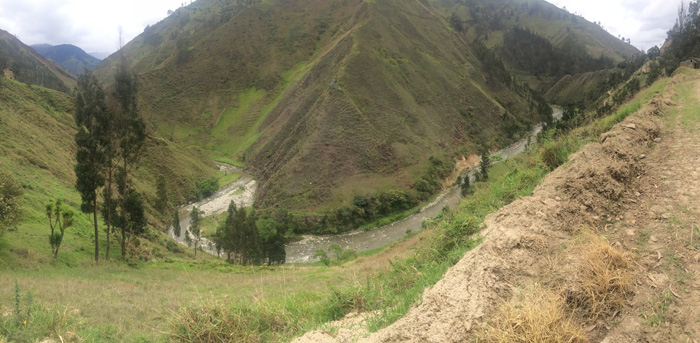
Fig. 1
Panoramic view of the valley and city of Loja.
|
|
The valley of Loja, oriented from north to south, is divided into two different sections.
The northern section is narrow, resembling a canyon.
The southern section, properly the valley of Loja,
is oval-shaped, with a total length comprising about 9 km and a maximum width of about 6 km (Fig. 2).
|
(Click on image to display)
Fig. 2
Aerial view of the Loja valley.
(Click --here-- to maximize).
|
|
The Malacatos river has its headwaters in the Cajanuma Knot (Fig 3), flowing north to
meet the Zamora river at Loja proper.
Continuing to flow north, the Zamora river flows through the Guagra-uma knot (Fig. 4), after which it meets
several tributaries along its course, eventually discharging into the
Santiago river in the eastern lowlands of Zamora-Chinchipe province.
|
Fig. 3
The Cajanuma Knot.
|
|
The interandean valley of Loja is small and low, at 2150 m
altitud, with the city of Loja occupying almost the entire valley.
The lowest point on the road (pass) from Loja through Cajanuma
Knot to the south is at 2525 m altitude. The lowest
point on the road from Loja to Catamayo to the west is at
2786 m; this pass is next to Villonaco peak, which rises to about 3000 m (Wolf, 1892).
|
Fig. 4
The Zamora river, near Guagra-uma Knot.
|
|
This study seeks to calculate climatological gradients in the Loja valley.
The study is part of a research program in
ecohydroclimatology of the tropics carried out jointly by San Diego State University (San Diego,
California, USA) and the
Universidad Técnica Particular de Loja (Private Technical University of Loja),
Ecuador (UTPL).
The logistical support for the field studies was provided by UTPL.
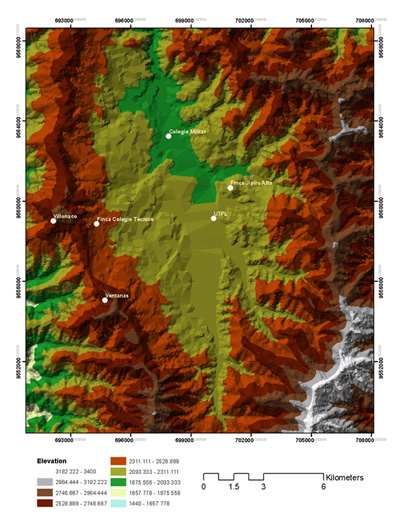
2. DATA BASE
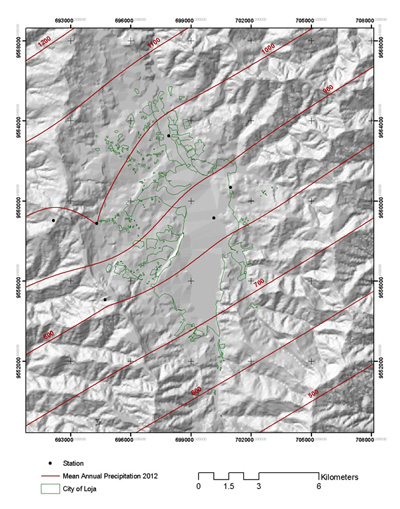
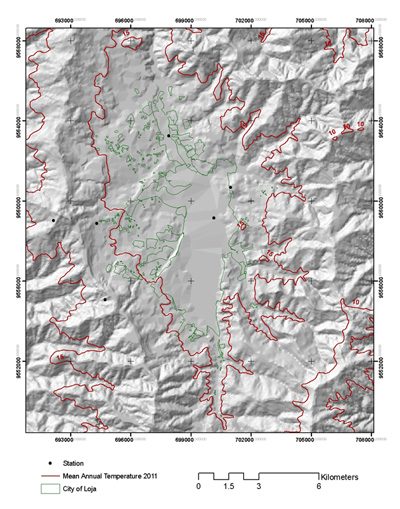
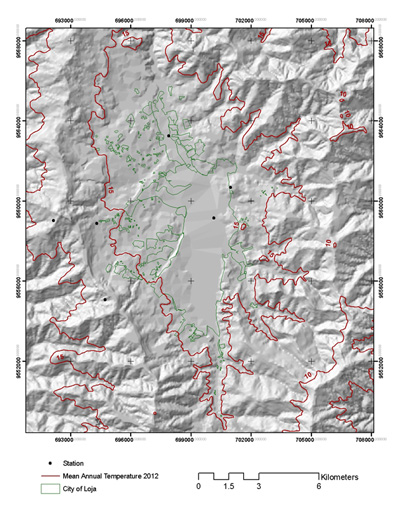
Data from seven (7) climatological stations in the Loja valley and vicinity
were used for this study (Table 1 and Fig. 2).
The Universidad Tecnica Particular de Loja
operates the first six (6) stations listed in Table 1. In addition,
data from the climatological station at La Argelia (in Loja),
operated by the Instituto Nacional de Meteorologia e Hidrologia (INAMHI) was used.
Precipitation and temperature data for the years 2011 and 2012
were used to determine the spatial distribution of precipitation and temperature.
The spatial distribution of mean annual precipitation was determined by kryging, using
ArcGIS®. To determine the isotherms,
the mean annual temperature calculated at-a-station (Table 1) was correlated with elevation
above mean sea level. The results are shown in Figs. 5 to 8.
Table 1. Climatological stations used in this study.
| Station |
UTM
(x) |
UTM
(y) |
Elevation (m) |
P (2011) (mm) |
P (2012) (mm) |
T (2011) (°C) |
T (2012) (°C) |
| Colegio Militar |
697901 |
9563240 |
2033 |
1058.60 |
965.20 |
16.57 |
16.67 |
| Finca Jipiro Alto |
700975 |
9560679 |
2218 |
892.80 |
874.80 |
15.25 |
15.27 |
| UTPL |
700135 |
9559140 |
2154 |
874.40 |
833.22 |
16.29 |
16.40 |
| Finca Colegio Técnico |
694294 |
9558872 |
2377 |
1241.25 |
1000.80 |
14.34 |
14.38 |
| Ventanas |
694716 |
9555060 |
2816 |
1104.00 |
811.60 |
11.07 |
10.97 |
| Villonaco |
692138 |
9559012 |
2952 |
1013.60 |
976.80 |
10.52 |
10.36 |
| La Argelia |
699718 |
9553624 |
2160 |
1338.60 |
1096.40 |
16.2 |
16.3 |
|
|
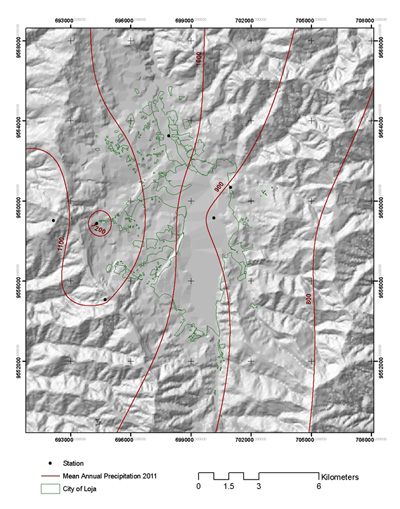
(Click on image to display)
Fig. 5
Mean annual precipitation in the Loja valley in 2011
(Click --here-- to maximize).
|
|
|
(Click on image to display)
Fig. 6
Mean annual precipitation in the Loja valley in 2012
(Click --here-- to maximize).
|
|
|
(Click on image to display)
Fig. 7
Mean annual temperature in the Loja valley in 2011
(Click --here-- to maximize).
|
|
|
(Click on image to display)
Fig. 8
Mean annual temperature in the Loja valley in 2012
(Click --here-- to maximize).
|
|
3. ANALYSIS
The spatial analysis using ArcGIS® shows a definite gradient of mean annual precipitation in the north-south direction.
Given a complete data set of two years (2011 and 2012), mean annual precipitation varies from a low of 900-950 mm toward the northern limit of the valley
to a high of 1150-1400 mm near the southern limit. The difference is attributed to
the higher elevation of Cajanuma Knot to the south,
as compared to that of Guagra-uma Knot to the north (Fig. 2).
Mean annual precipitation averages 900 mm around the center of the valley.
Thus, from the standpoint of environmental moisture, the city of Loja is strategically positioned
near the middle of the climatic spectrum, with a
subhumid climate in the low range (Ponce et al., 2000). Mean annual temperature in the valley's center
is around 16°C, considered as a mild climate. These values are close to optimal from the standpoint of
biotic potential (Ponce and Aguilar, 2014).
4. SUMMARY
Mean annual precipitation and mean annual temperature along the Loja valley, Ecuador,
have been calculated using data from seven (7) climatological stations, six (6) of them operated by the
Universidad Técnica Particular de Loja, and one (1)
by the Instituto Nacional de Meteorologia e Hidrologia.
The results show a definite gradient of mean annual precipitation in the north-south direction.
Mean annual precipitation varies from a low of 900 mm toward the northern limit of the valley
to a high of 1400 mm near the southern limit. The difference is attributed to
the higher elevation of Cajanuma Knot to the south,
as compared to that of Guagra-uma Knot to the north.
Mean annual precipitation along the valley's center averages 900 mm, while
mean annual temperature is around 16°C. Both of these values are judged to be near optimal
from the standpoint of biotic potential.
REFERENCES
Ponce, V. M., R. P. Pandey, and S. Ercan. 2000.
Characterization of drought across climatic spectrum.
Journal of Hydrologic Engineering, ASCE, Vol. 5, No. 2, April, 222-224.
Ponce, V. M. and R. D. Aguilar. 2014. The 800-mm isohyet:
Health and hope. EWRI Congress: International Perspectives on
Water Resources and the Environment, Quito, Ecuador, January 8-10, 2014.
Ponce, V. M., and F. Oñate-Valdivieso. 2014. Ecohydroclimatological
research along the Catacocha-Zamora transect, Loja and Zamora-Chinchipe,
Ecuador.
Wolf, T. 1892. Geografía y Geología del Ecuador, publicada por orden del Supremo Gobierno de la República, Leipzig, Germany.
|