1. INTRODUCTION There are approximately 50,000 dams in the United States, 40% of which have been classified as potentially dangerous to life and property in the event of a failure (23). The majority of these dams are earth embankments, and failure of earth embankments is usually associated with some type of breaching. Despite these impressive statistics, very little is known about the breach itself - its inception, shape, and rate of development. The few documented earth dam failures have shown one striking common denominator: the failure is anything but sudden. For instance, in the overtopping case a breach will form and grow gradually under the erosive action of the waters. This gradual failure of an earth dam is of particular interest to disaster relief planners, because the rate of growth of the breach strongly influences the peak and shape of the ensuing flood wave. Gradual failure here should be contrasted with the commonly assumed sudden (or instantaneous) failure, although the former probably amounts to only a few hours in most cases. The objective of this paper is to present a mathematical model of the gradual failure of an earth dam. The main body of the paper contains a review of the pertinent literature and a description of the model formulation. The mathematical model is tested using data from the Huaccoto dam failure, which occurred in central Peru in June, 1974.
At this stage of the model development, the overall objective is to achieve a physically realistic simulation of the gradual failure of an earth embankment caused by an overtopping flood event. Considerable research is available for the case of instantaneous failure of a dam. Reference is made to papers by Ritter (16), Dressler (5), and Whitham (25), to name a few. Instantaneous failure causes a positive wave in the downstream direction and a negative wave in the upstream direction. As evidenced by recent work of Brown and Rogers (1), such an assumption is likely to be far from reality in the case of a gradual breach. In their investigation of the Teton Dam failure, Brown and Rogers documented a control section that formed just upstream of the breach, and described how the reservoir level dropped uniformly upstream of this section, preventing the negative wave from propagating upstream. The duration of the Teton breach was approximately 3 hours. Cristofano's work is perhaps the first attempt to simulate the growth of a breach in an earth dam. Using geotechnical principles, Cristofano equated force of water flowing through the breach to resistive shear strength acting on the bottom surface of the overflow channel. Thus, he was able to relate rate of change of erosion to rate of change of water flowing through the overflow channel. This analysis led to an algebraic equation relating amount of eroded material to flow of water through the breach. Cristofano assumed that the breach top width would remain constant over time, and that the breach would maintain a trapezoidal shape throughout the failure process. In addition, he fixed side slopes of the breach equal to angle of repose of the bank material, and bottom slope of overflow channel equal to angle of friction of bed material. However, the use of an arbitrary constant in Cristofano's formula renders it, in effect, empirical. In spite of this limitation, the formula has been used in preliminary estimates of dam breach potential, as evidenced by TVA (Tennessee Valley Authority) practice (13). In the late 50's, the United States Army Corps of Engineers Waterways Experiment Station (WES) used physical models to conduct an extensive investigation into floods resulting from suddenly breached dams (21,22). A correlation was found between peak oulflow from a suddenly breached dam and a shape factor describing the geometry of the breach. The WES findings support the conclusion that the Froude number based on peak flow would reach a value of 0.29, which verifies the Schoklitsch equation (19) for peak outflow from a sudden dam failure. The WES findings do not apply to the case of a gradual breach of an earth dam. The experiments were carried out in a laboratory flume of specified bed slope, cross section, and roughness characteristics, and the failure was simulated by an almost instantaneous removal of part or all of the dam. Therefore, while the tests were representative of sudden failure case, the results cannot be associated with gradual failures because the hydraulics of the two cases are in fact quite different. Prince et al. (15) of the TVA have reported on models that use the relations for sudden dam breaches developed by WES. They do not apply their models to earth dams, but rather to sudden failure of large gravity dams. Su and Barnes (20) studied geometric and frictional effects of sudden releases, and concluded that both resistance and cross-sectional shape were significant in determining the behavior of waves caused by sudden releases.
Brown and Rogers (1) developed a computational model based on earlier work by Harris and Wagner (9), in which the Schoklitsch formula was used to compute suspended sediment. Brown and Rogers make several rather lucid statements regarding the mechanics of breach development. They point out the need for incorporating lateral erosion into the model simulation. They also address some of the differences in modes of failure for exceptionally high earth dams as opposed to long, low embankments. In addition, they point out that the bulk of the material eroded from the breach is deposited almost immediately downstream of the dam, thus affecting tailwater depths and outflow hydrograph.
Fread (7) has substantially contributed to modeling of dam breach phenomena in recent years. Fread assumes the rate of growth of the breach to be time-dependent, with either rectangular, triangular, or trapezoidal shape. He accomplishes this by considering vertical erosion to take place at a constant, predetermined rate. This assumption is convenient because it allows the time scale of the phenomena to be fixed a priori. However, it renders the model incapable of predicling the breach-induced flood wave properties. It can produce a range of flood events for a given range of vertical erosion rates, but which flood event is likely to occur is not discernible. Fread does indicate that the outflow hydrograph is extremely sensitive to the chosen rate of vertical erosion, but assumes any errors in prediction to be dampened as the sharp wave moves downstream. Fread's main concern is the downstream valley routing of the flood wave from a breached earth dam, which is the ultimate goal of any investigation of potential dam breaches. However, it should be emphasized that the rate of erosion and mode of failure of dam determine to a large extent the shape and duration of the flood wave. Until this mechanism is better understood and properly described by mathematical modeling, Fread's approach can be considered only as an approximation giving a range of probable events.
For a useful description of dam incidents in the United States, reference is made to an 2. THEORETICAL DEVELOPMENT The model described herein has five major components: (1) Numerical scheme; (2) channel resistance; (3) sediment routing; (4) breach morphology; and (5) initial and boundary conditions. Numerical Scheme. Extensive literature on unsteady flow and numerical models justifies using an implicit solution of the dynamic wave to simulate a gradual breach . The rate or rise of the outflow hydrograph is fast compared with the usual stream channel flood waves. Therefore, its adequate description should consider the inertia terms in the equation of motion, i.e., a dynamic wave model. The four-point implicit scheme, also referred to as Preissmann's scheme (11), is used in the simulation. In theory, this scheme is unconditionally stable. In practice, however, it is often necessary to introduce a weighting factor to damp out disturbances of the same scale as the grid size. In addition, proper specification of initial and boundary conditions is crucial to the stability and convergence of the numerical solution. The success of the Preissmann scheme is well documented in the literature. Channel Resistance. No closed form expression for channel resistance is available, and empirical equations continue to be used in practice. These equations have been derived for equilibrium flow conditions, and their application to unsteady flow is justified on practical grounds.
The model uses the Manning equation to describe the resistance of the channel bottom.
Sediment Routing. The sediment routing component has two major features:
(1) Numerical solution of the sediment continuity equation (the Exner equation); and (2) computation of bed material transport using a bedload formula suitable for application to high Froude number flows.
The choice of a suitable bed load function applicable to high Froude number flows remains primarily one of computational convenience. Phenomenological models such as that of Einstein (6) are attractive, considering the physical detail that can be incorporated into the simulation. However, the complexity and associated expense of these models is a definite limitation. On practical grounds, a simpler and yet reliable equation such as that of Meyer-Peter and Müller was selected.
in which qs = bed material transport rate by weight, per unit of channel width; τ = bottom shear stress; τc = critical shear stress (shear stress at incipient motion); and a and b = coefficient and exponent, respectively. A value of b = 1.5 is widely recognized in connection with high Froude number flows, while the value of a is based on experience. The bottom shear stress is expressed by the following formula:
in which γ = density or waler; d = flow depth; and Sf = friction slope. The critical shear stress is expressed as follows:
in which γs = density of solids; and D50 = median grain size of bed material. For steep slopes and high sediment transport rates such as in the dam breach case, the bottom shear stress is likely to be several orders of magnitude larger than the critical shear stress. Therefore, Eq. 1 can be simplified to the following:
Breach Morphology. The model includes a component to tie the cross-sectional geometry of the breach to the outflow from the failing dam. This relation must function as an additional degree of freedom to represent the vertical and lateral development of the breach in a physically realistic way. At its present stage of development, the breach morphology component consists of a relation between top width and flow rate. The existence of such a relation is rooted in the work on regime channels. It is used here for nonequilibrium channels for lack of a rigorous theory of breach morphology. This aspect of the modeling can be readily improved as additional research helps clarify the governing morphological principles. The recent works of Parker (14) and Chang (3) are important steps in this direction. Initial and Boundary Conditions. Correct specification of initial and boundary conditions is a crucial aspect of modeling. Computational convenience dictates that initial values of hydraulic variables be finite, i.e., nonzero. Therefore , a small but finite flow is specified as initial condition on the downstream side of the dam. Hydraulic conditions are determined using steady flow principles. The upstream boundary condition is the reservoir water surface level. In addition, the elevation of the top of dam is specified. Outflow at start of the computation is a function of the specified size of the rivulet. Progressive erosion widens and deepens the rivulet, increasing outflow and erosion rate in a self-generating manner. The upper cross section on the sloping dowostream face "creeps" upstream across the dam top until it reaches the upstream face, whereby rate of flow and erosion increase at a faster rate. If outflow increases enough to lower the reservoir level faster than the channel bed erodes, both outflow and erosion gradually diminish. Of course, outflow will eventually decrease even if the breach bed erodes all the way down to the streambed. This mode of failure creates the outflow hydrograph in the shape of a sharp but nevertheless gradual flood wave. 3. MODEL DESCRIPTION The mathematical model assumes an overtopping failure of an earth embankment, whereby a breach begins to grow at some low or weak point of the crest and downstream face. This is a likely form of small embankment failure. The actual task of modeling by computational means can be quite demanding. Many calculations must be assembled in a logical and stable framework to achieve a workable numerical solution.
The model has the following major parts: (1) Input data and initial conditions;
(2) cross-sectional characteristics; (3) matrix coeficients and double sweep solution; (4) breach geometry descriptor; lnput data and initial conditions. Subroutines are used to input data such as initial area, width, depth and flow rate, dam and breach geometry, soil characteristics, roughness coefficients, spatial and temporal resolution, etc. Cross-sectional characteristics. The cross-sectional characteristics are described by the following algebraic relations:
and
in which y = stage; A = cross-sectional area; P = wetted perimeter; and α and a1, β and b1 are coefficients and exponents, respectively. A least square fit is used to determine the coefficients and exponents of Eqs. 5 and 6 as a function of distance (along the breach channel) and time (achieved by updating the cross-sectional parameters after every time step). Matrix coefficients and double-sweep solution. These model components calculate the coefficients of the discretized Saint Venant equations and solve the resulting matrix by the double sweep solution technique. For a detailed treatment of the discretization following the Preissmann scheme, reference is made to Liggett and Cunge (11).
Breach geometry descriptor. To properly describe the gradual breaching of an earth dam, This descriptor of breach geometry provided satisfactory results and allowed greater flexibility and an altogether better simulation. Future model upgrading should focus on identifying the underlying erosional mechanisms and incorporating them inlo the simulation scheme. Sediment transport. The model uses the equation of sediment continuity (the Exner equation) to describe the erosive processes at the channel bed. The Exner equation is given as follows:
in which Qs = sediment transport rate, by weight; p = porosity of material forming the bed; To describe sediment transport rate, the Meyer-Peter and Müller equation is used. On this basis, a simple yet reliable relation between sediment transport rate and mean velocity can be postulated. Consequently, breach erosion rate can be related to breach hydraulics. Reservoir routing. This model component determines the upstream boundary condition, i.e., the upstream stage and flow depth. This is accomplished by computing the rise/drop in reservoir level within one time step as follows:
in which ΔH = rise/drop in reservoir level from time level n to time level n + 1; Qout = flow rate at upstream section of breach at time level n; Qin = inflow to the reservoir at time level n; Δt = time step; and An = reservoir surface area at time level n. Eq. 8 amounts to a local linearization of the upstream boundary condition; its accuracy is contingent upon its use with reasonably small time steps. The aforementioned upstream boundary condition computed as indicated provides the mechanism that triggers the development of the breach. As the upstream flow depth increases, the flow rate and velocity also increase, leading to the breach enlargement. The process is halted when the reservoir is depleted to the point where the upstream flow depth and velocity can no longer sustain any further erosive action.
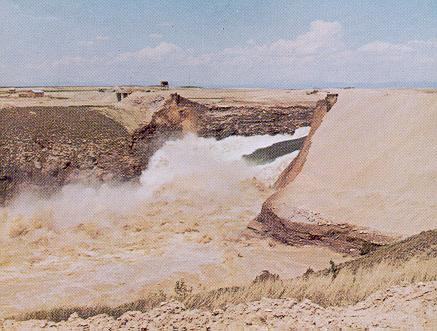
4. CASE STUDY: HUACCOTO NATURAL DAM, PERU The Huaccoto natural dam was formed as a result of a landslide thai occurred in Cochacay Creek, a tributary of the Mantaro River in Central Peru, in April, 1974. The embankment created behind it a huge reservoir which took approx 60 days to fill. The failure occurred by overtopping, whereby a breach developed and grew progressively under the erosive action of the waters. The large volume of material encompassing the embankment made this particular failure somewhat unusual. Rodriguez (17) has stated that there was enough material to build an engineered dam about three times as high in the same location. First, the breach did not erode to datum, but rather, erosion stopped when the available water in the reservoir was insufficient to sustain further breach growth. Second, the duration of the failure was approx 48 hours, including breach development and reservoir depletion. This is in sharp contrast to documented failure times for engineered dams, which usually take at most a few hours to erode to datum. Of course, the dam thickness, and thus, the amount of material to be eroded in an engineered dam would be much less than that of the Huaccoto dam.
The overall characteristics of the Huaccoto embankment and reservoir are (18): (1) Reservoir capacity = 665 millions of m3; (2) maximum height of embankment = 170 m; (3) lateral length of embankment = 3,800 m; (4) approximate crest elevation = 2,630 m above mean sea level; Table 1 shows a comparison of estimated actual versus simulated flood characteristics. It should be emphasized that the estimated actual values shown are by no means exact, considering the strenuous circumstances under which they were made. The simulated results agree reasonably well with the estimated actual values, further demonstrating the potential of this modeling tool in the assessment of postulated embankment failures.
5. SUMMARY AND CONCLUSIONS A simulation model of the gradual failure of an earth embankment has been formulated, developed, and tested with real-life data. A significant feature of the model is its ability to account for the growth of the breach and the eventual draining of the reservoir behind the embankment. Concepts of water and sediment routing are used in conjunction with a channel geometry descriptor to arrive at a self-contained mathematical model of the breach enlargement and the ensuing flood wave. Unsteady flow elements of the simulation are an implicit numerical solution of the complete Saint Venant equations coupled with a sequential sediment routing technique. This approach provides an increased rational basis for determining outflow hydrographs from postulated earth dam breaches. The model is tested on the failure of the natural embankment which formed in April, 1974, on the Mantaro River in central Peru, as a result of an earthquake-generated landslide. Agreement between estimated actual and simulated flood characteristics is remarkable, considering the coarseness of the physical detail incorporated at this early stage of model development. The need for this type of analysis is supported by recent findings of a National Science Foundation-sponsored workshop which convened to delineale priorities in hydraulic and hydrologic research. According to the workshop report (2), government regulations are now requiring that embankments be analyzed against potential failure due to overtopping. At present, such evaluations are primarily based on scant data available from a few documented failures. With mathematical models becoming more widely available, there is a definite trend toward the use of these improved ways of analyzing gradual embankment failures. ACKNOWLEDGMENTS The writers are in debted to J. D. Salas, who provided the data on the Huaccoto dam failure, and to the anonymous reviewers for their constructive criticism of the original manuscript. APENDIX I. REFERENCES
APENDIX II. NOTATION
The following symbols are used in this paper:
A = cross-sectional area; | ||||||||||||||||||||||||||||||||||||||||||||||
| 211226 |
| Documents in Portable Document Format (PDF) require Adobe Acrobat Reader 5.0 or higher to view; download Adobe Acrobat Reader. |