|
San Diego County, California
Department of Civil, Construction, and Environmental Engineering, San Diego State University, San Diego, CA 92182-1324; PH (619) 594-4029 email: ponce@ponce.sdsu.edu; rosadelmi@gmail.com
INTRODUCTION
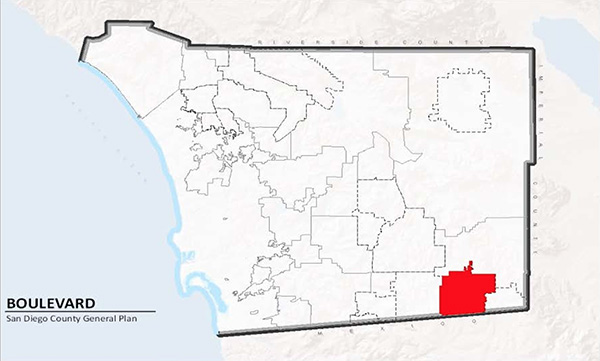
Boulevard and its surrounding communities are located in southeast San Diego County, California,
at a distance of about 50 miles from the city of San Diego, near the border with Imperial County.
These communities and the resources they rely upon are being threatened by the development of
industrial-scale alternative energy projects (solar and wind) that, if carried to completion,
promise to permanently change their essentially rural character.
Intensive development in a desert region such as Boulevard poses significant challenges due to increased water demands, while the supply remains essentially unchanged. Boulevard and surrounding communities are fully reliant on groundwater, since there is no economically viable alternative. The question is: To what extent will the increased amounts of groundwater needed for energy infrastructure development tax the capacity of the regional aquifer to satisfy the needs of all users, old and new? The issue of how much groundwater to pump before the operation becomes unsustainable is something that has no easy answer. Conventional hydrogeology argues that a safe yield may be taken as the amount of recharge to a suitable control volume. This approach has been widely discredited in the past 15 years. It would only make sense if groundwater is a volume; yet, groundwater is not a volume, but a flux. Sequestering all the recharge means sequestering all the discharge, effectively drying up all downstream uses and/or users. This study analyzes the cumulative impacts of the renewable energy projects currently being planned in Boulevard and surrounding communities. The report focuses on the issues of groundwater sustainability in light of the additional water demand resulting from the proposed intensive development of this desert region. The cumulative impacts of these projects on the regional water resources are assessed.
WATER DEMAND
The population of Boulevard and surrounding communities is estimated as 1,500
persons.
Assuming the typical number of four (4) persons per household, the number of households in the study area
is estimated as follows: The Golden Acorn Casino has an area of 40,000 square feet and it features 750 slot machines, blackjack tables, video poker games, video keno games, a gas station, a restaurant, a deli, and a full-service cocktail lounge. The water demand for the Golden Acorn Casino has been estimated as 150,000 gallons per day. This is based on an estimate of the volume of treated water ranging from 0.15 to 0.30 million gallons per day. This water demand is equivalent to 168 ac-ft/yr.
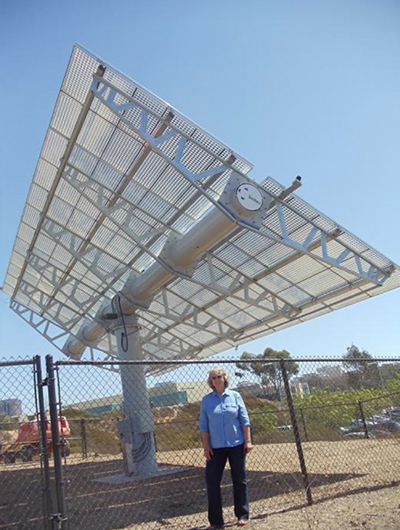
The recently completed Boulevard Border Patrol Station sits on a 31-acre rural site just off Interstate 8 (I-8) in Boulevard, California. The station includes a main station building for 250 agents and support staff, a vehicle and maintenance facility center, an equestrian compound with a stable and an arena, a 160-ft communications tower, a vehicle wash rack with recirculating water system, a fueling station, a 10-lane 50-m indoor firing range, a back generator, an emergency helipad, access roads, parking, fencing, security lights, and other site support. Water for the new station is provided by new wells drilled as part of the project. Based on an average usage of 250 gallons per person per day, the estimated water usage for 250 persons is 62,500 gallons per day, which is equivalent to 70 ac-ft/yr. The McCain Valley Conservation Camp engages in all forms of risk disaster mitigation, pre-fire fuel management, the development and maintenance of fire defense improvements and facilities, and the performance of conservation-related projects for local, state, and federal agencies. The total number of camp inhabitants is 136. Based on an average usage of 250 gallons per person per day, the estimated water usage for 136 persons is 34,000 gallons per day, which is equivalent to 38 ac-ft/yr. The total water demands for existing users, including Boulevard and surrounding communities, Golden Acorn casino, Border Patrol Station, and McCain Valley Conservation Camp, is 463.5 ac-ft. The energy projects plan to install 7,290 CPV trackers similar to the one shown in Fig. 2. The cumulative water demand of the energy projects planned in Boulevard and surrounding communities is 166.04 million gallons, which is equivalent to 509.6 ac-ft (Ponce 2013). Thus, the total projected water demand, with energy projects in place, would be: 463.5 + 509.6 = 973.1 ac-ft.
WATER SUPPLY In general, the water resources of a community or group of communities are derived from both surface water and groundwater. For a specific case, the percentage of surface water use as compared to groundwater use is likely to vary widely. Particularly for the case of Boulevard and surrounding communities, the percentage of surface water use is negligible. Given the different nature of surface water and groundwater, an analysis of the availability of water in a given area or region must consider the following facts:
Boulevard and surrounding communities are located in southeast San Diego County, California. The Campo weather station, located immediately west of the study area, has a long precipitation record, spanning the 64-year period from 1949 to 2012. The calculated mean annual precipitation at the Campo gage is 14.41 in, or 366 mm. This corresponds to an arid climate. An arid climate typically has little surface water and, consequently, little runoff. The lack of surface water has forced Boulevard and surrounding communities to rely of groundwater almost exclusively for their water needs. GROUNDWATER Groundwater is almost always in constant movement, driven by local or regional hydraulic gradients. The source of all groundwater is percolation from surface water originating in precipitation. The fate of groundwater is either:
Globally, 98% of groundwater appears as baseflow somewhere downstream, while only 2% flows directly into the nearest ocean (World Water Balance 1978; L'vovich 1979). The recharge to groundwater is typically expressed as a percentage of precipitation. Hydrologic data shows that recharge to groundwater varies proportionally with mean annual precipitation. Semiarid and arid regions have proportionally less recharge to groundwater than subhumid and humid regions. In theory, the recharge to groundwater can be evaluated by performing a water balance, where infiltration (I) is calculated by subtracting evaporation (E), evapotranspiration (T) and runoff (Q) from precipitation (P). In practice, however, the natural prototype or system does not lend itself readily to description. While a fraction of the infiltration goes on to constitute recharge, another fraction returns to the atmosphere as the evaporation and evapotranspiration of wetlands and riparian ecosystems. In general, the soil system is heterogenous, anisotropic, and subject to spatial and temporal variations in soil/air/water complex characteristics. Therefore, it is almost impossible to discern with any degree of certainty what fraction of the infiltration actually made it into recharge, and what fraction returned to the atmosphere as evaporation/evapotranspiration. Over the years, classical hydrology and hydrogeology have seemed unable to resolve this dichotomy. The situation has been resolved by L'vovich, who developed an alternate formulation of the water balance using the concept of catchment wetting (L'vovich 1979, Ponce 1995) ). Catchment wetting is defined as the fraction of precipitation not contributing to direct surface runoff. L'vovich's approach to the water balance consists of the following steps, shown in Table 1:
GROUNDWATER RECHARGE Barring a calculation of groundwater recharge using L'vovich's methodology, the only recourse appears to be to evaluate groundwater recharge using a synthetic approach, on the basis of a host of data and analyses reported in the literature, keeping in mind that recharge varies proportionally to precipitation. On the dry side of the climatic spectrum, where precipitation is near zero, the recharge percentage is also close to zero (0%). This is the case of superarid regions, with mean annual precipitation less than 100 mm. Conversely, on the wet side of the climatic spectrum, with precipitation greater than 6,400 mm, recharge is a very large fraction of precipitation, often exceeding 40%. This is the case of superhumid regions, as shown in Table 5. In the middle of the climatic spectrum, with mean annual precipitation equal to 800 mm, recharge is estimated to be around 20% (Ponce 2012).
The average global values notwithstanding, Scanlon et al. (2006) have performed a global synthesis of
groundwater recharge in semiarid and arid regions, using approximately 120 study areas,
including the U.S. Southwest. They report values of recharge varying between 0.1% and 5.0%
of mean annual precipitation. A value of groundwater recharge for the Boulevard and surrounding
communities equal to 5% of mean annual precipitation
is considered to be reasonable, given that mean annual precipitation is equal to 366 mm or 14.41 in, corresponding to an arid climate.
Thus, average annual groundwater recharge is: (5/100) × 366 = 18.3 mm.
This is equivalent to: SUSTAINABLE YIELD In the case of Boulevard and surrounding communities, which rely exclusively on groundwater, the question is: How much groundwater can be pumped from the regional aquifer and still remain sustainable? Or rather, what is the sustainable yield of groundwater in the study area? It has now been generally accepted that sustainable yield is a moving target, subject to adaptive management (Seward 2006). It cannot be taken as equal to the groundwater recharge, because this would end up sequestering all the discharge (Sophocleous 1997). Since sustainable yield is not related to the recharge, it follows that sustainable yield must be related to the discharge, that is, the percentage of discharge that must be reserved for hydrologic (baseflow) and ecohydrologic (wetlands and riparian ecosystems) uses. In other words: What percentage of the discharge can society afford to capture through well pumping for new development and still satisfy other uses or users? The answer is seen to depend more on hydrologic, ecohydrologic, and socioeconomic factors than on hydrogeology. Thus, studies of groundwater potential that are strictly based on hydrogeology are bound to be incomplete. Sustainability refers to renewable natural resources; therefore, sustainability implies renewability. Groundwater is neither completely renewable nor completely nonrenewable; therefore, the question of how much groundwater pumping is sustainable is appropriate. In principle, sustainable yield is that which is in agreement with sustainable development. This definition is clear; however, its practical application requires the understanding of complex interdisciplinary relationships. Alley et al. (1999) defined groundwater sustainability as the development and use of groundwater in a manner that can be maintained for an indefinite time without causing unacceptable environmental, economic, or social consequences. Loucks (2000) observed that the assessment of groundwater sustainability must involve professionals from various disciplines. Sustainability studies require a balance of the entire hydrological system, not just of the aquifer. Sustainability implies a basic change in focus from groundwater as an exploitable human resource (the "basin yield" view) to groundwater as a vital part of the complex interrelated processes governing ecosystem health and flow system stability (National Research Council, 2000). Maimone (2004) reasoned that if sustainable yield must be all-inclusive, the idea that there exists a single, correct number representing sustainable yield must be repealed. Instead, he proposed a working definition based on the following components:
Seward et al. (2006) found serious problems with the simplistic assumption that sustainable yield should equal recharge. In many cases, sustainable yield will be considerably less than average annual recharge. Natural recharge does not determine sustainable yield; rather, the latter is determined by the amount of capture that it is permissible to abstract without causing undesirable or unacceptable consequences. AREA OF INFLUENCE All groundwaters are connected; therefore, ever increasing amounts of capture are likely to draw groundwater volumes from an ever increasing area. This fact has been thoroughly documented; see, for instance, the case study of Paradise Valley, Nevada, by Prudic and Herman (1996). Prudic and Herman (1996) showed the evolving nature of capture with long-term groundwater development. Using the aquifer of Paradise Valley, in Humboldt County, Nevada, as an example, they found that pumping 48% of the recharge for 300 years produced:
This case study clearly shows that, in general, the control volume in groundwater flow is not limited, and that increasing capture is likely to result in an expansion of contributing areas and associated volumes. Thus, the fallacy of using surface drainage area as the control volume on which to base an estimate of sustainable yield.
The average annual groundwater recharge in the study area, or recharge depth, is: R = 0.06 ft.
To determine sustainable yield, the first step is to determine the area of influence (A) and, consequently, the recharge volume (V).
Recharge volume is equal to the recharge depth times the area of influence: The selection of the area of influence is an elusive task (Bredehoft 1997). As a first approximation, the Boulevard Planning Area is taken as the cumulative reference area on which to base the computations of sustainable yield. The Boulevard Planning Area is 55,350 acres. CAPTURE-TO-RECHARGE For the sake of comparison, it is instructive to examine the range of practical values of capture-to-recharge percentage. Values of capture-to-recharge vary from 0% in undeveloped basins, to about 10% in average basins, to more than 100% in highly developed basins. For instance, an average value of capture-to-recharge in the Continental United States has been reported as 8.7% (Alley et al. 1999). Moreover, some highly developed basins may have capture-to-recharge percentages exceeding 100% (Ponce 2012). This fact confirms that the control volume in hydrogeology is not limited, with increasing amounts of capture compromising increasing surface areas and associated volumes. To determine sustainable yield in the study area, an appropriate value of capture-to-recharge must be selected. A rational approach is to start with a small percentage of capture-to-recharge and develop data and experience to justify an increase when warranted. In the absence of comprehensive interdisciplinary studies, values of capture-to-recharge between 10% and 30% are considered appropriate (Sophocleous 1997; Ponce, 2012). Table 2 shows the calculated sustainable yield in the study area, for postulated values of capture-to-recharge varying between 10% and 30%.
CONCLUSIONS The following conclusions are formulated in this study:
Most groundwater wells in the study area are drilled and maintained by local homeowners. Thus, the cost of mitigating possible well interference will come at their own expense, even though the source of the problem may be an industrial project located in the vicinity. The folly of intensive development of the desert and its implications for groundwater resource management have been examined elsewhere (Glennon 2002). One fact remains uncontested: Almost all groundwater is in transit to the neighboring surface water (Sophocleous 1997). Therefore, usage of groundwater should be reduced to the minimum amount that can be proven not to adversely affect surface water and/or related ecological resources (wetland and riparian) in the vicinity. An interdisciplinary approach is needed, one that goes beyond hydrogeology to encompass surface water, ecohydrology, and socioeconomic aspects. A major rezoning of a rural area into industrial area necessitates that the additional sources of water be clearly identified at the outset. REFERENCES
Alley, W. M., T. E. Reilly, and. O. E. Franke. 1999. Sustainability of ground-water resources. U.S. Geological Survey Circular 1186, Denver, Colorado, 79 p.
Glennon, R. 2002. Water Follies: The Tragedy of Law and the Commons. Inland Press.
L'vovich, 1979. World water resources and their future.
Translation of the original Russian edition (1974), American Geophysical Union, Washington, D.C.
Maimone, M. 2004. Defining and managing sustainable yield. Ground Water, Vol. 42, No. 6, November-December, 809-814.
National Research Council. 2000. Investigating groundwater systems on regional and national scales. Committee on USGS Water Resources Research, Water Science and Technology Board, Washington, D.C.
Ponce, V. M., and A. V. Shetty. 1995. A conceptual model of catchment water balance. 1. Formulation and calibration. Journal of Hydrology, 173, 27-40.
Ponce, V. M., R. P. Pandey, and S. Ercan. 2000. Characterization of drought across climatic spectrum. ASCE Journal of Hydrologic Engineering, Vol. 5, No. 2, April.
Ponce, V. M. 2012. Thompson Creek Groundwater Sustainability Study. http://tcgwss.sdsu.edu
Ponce, V. M. 2013. Cumulative impacts on water resources of large-scale energy projects
in Boulevard and surrouding communities, San Diego, California. Online report.
http://boulevardenergy.sdsu.edu
Prudic, D. E., and M. E. Herman. 1996. Ground-water flow and simulated effects of development in Paradise Valley, a basin tributary to the Humboldt River, in Humboldt County, Nevada. U.S. Geological Survey Professional Paper 1409-F.
Scanlon, B. R., K. E. Keese, A. L. Flint, L. E. Flint, C. B. Gaye, W. M. Edmunds, and I. Simmers. 2006. Global synthesis of groundwater recharge in semiarid and arid regions. Hydrological Processes, 20, 3335-3370.
Seward, P., Y. Xu, and L. Brendock. 2006. Sustainable groundwater use, the capture principle, and adaptive management. Water SA, Vol. 32, No. 4, October, 473-482.
Sophocleous, M. 1997. Managing water resources systems: Why "safe yield" is not sustainable. Editorial, Ground Water, Vol. 35, No. 4, July-August, 561.
World Water Balance and Water Resources of the Earth. 1978. U.S.S.R. Committee for the International Hydrological Decade, UNESCO, Paris, France. | |||||||||||||||||||||||||||||||||||||||