CIV E 445 - APPLIED HYDROLOGY
SPRING 2014
HOMEWORK No. 4
The following snow-chart and hypsometric data have been measured in a certain catchment:
Elevation (%) 0 10 20 30 40 50 60 70 80 90 100 Cumulative Area (%) 0 24 40 52 66 77 82 86 95 98 100 Snow-water equivalent (mm) 3 3 3 4 4 5 5 7 7 8 8 Determine the catchment's overall snow-water equivalent.
Given the following stream gaging data, calculate the discharge.
Vertical No. 1 2 3 4 5 6 7 8 9 10 11 Distance to ref. point (m) 15 20 25 30 35 40 45 50 55 60 65 Sounding depth (m) 0.0 0.6 0.9 1.3 1.6 2.6 3.1 2.1 1.3 0.8 0.0 Velocity at 0.2 depth (m/s) 0.0 0.5 0.7 0.9 1.2 1.4 1.7 1.3 0.9 0.7 0.0 Velocity at 0.8 depth (m/s) 0.0 0.3 0.5 0.7 0.9 1.1 1.4 1.1 0.7 0.5 0.0 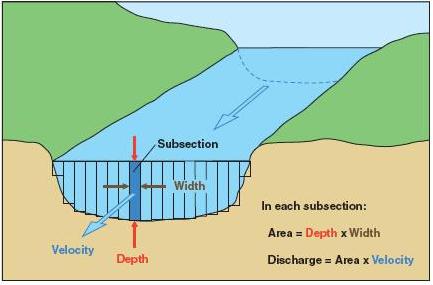
A certain substance is introduced at point A of a stream at the rate of 100 L/s with a concentration of 12,000 ppm. At a downstream point B, after complete mixing, the concentration of the substance is measured to be 15 ppm. Calculate the stream discharge.
Calculate the flood discharge of a certain stream by the slope-area method, given the following data: upstream flow area Au = 4022 m2, upstream wetted perimeter Pu = 770 m, upstream αu = 1.17, downstream flow area Ad = 3353 m2, downstream wetted perimeter Pd = 714 m, downstream αd = 1.21, fall F = 0.45 m, reach length L = 1,598 m, and reach Manning's n = 0.032. Verify using Slope Area calculator.