CIV E 445 - APPLIED HYDROLOGY
SPRING 2014
LAB No. 8 SOLUTION
The plotting position table is shown below.
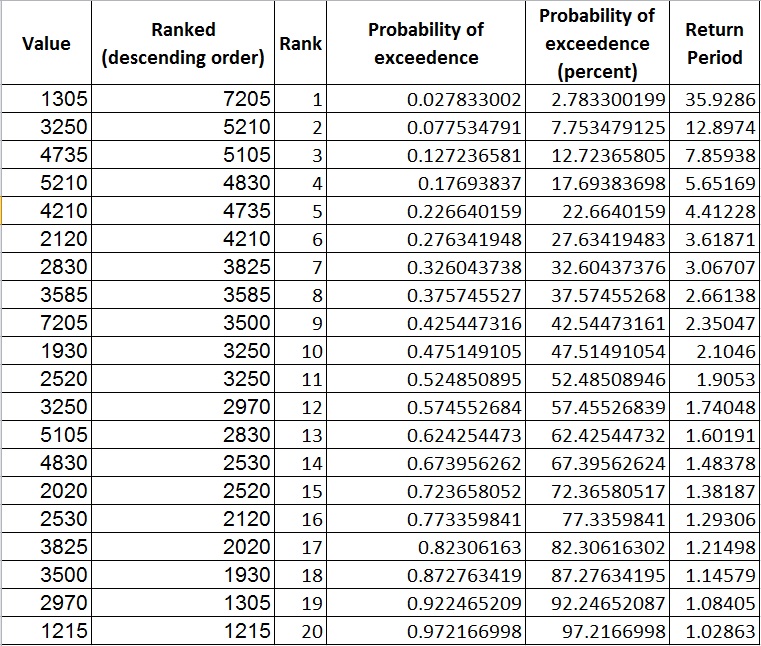
The Gumbel paper is constructed.
The plotting positions are plotted on the Gumbel paper.
The number of values is n = 20. The mean of the data is: 3407.25 cfs. The standard deviation is: 1492.46 cfs.
From Table A-8, for n = 20, the mean and standard deviation of the Gumbel variate are 0.5236 and 1.0628, respectively. The computations are summarized in the following table.
Return period
(yr)Probability of exceedence
(%)Gumbel variate Frequency factor Flood discharge
(cfs) (Hand)Flood discharge
(cfs) (Online)Difference
(cfs)| Hand - Online | 1.05 95 -1.113 -1.540 1109 1109 0 1.11 90 -0.838 -1.281 1496 1495 1 1.25 80 -0.476 -0.941 2003 2004 1 2 50 0.367 -0.147 3188 3187 1 5 20 1.500 0.919 4778 4778 0 10 10 2.250 1.624 5830 5832 2 25 4 3.199 2.517 7162 7164 2 50 2 3.902 3.179 8150 8151 1 100 1 4.600 3.836 9130 9132 2 200 0.5 5.296 4.490 10106 10109 3 The Gumbel fit is plotted on the Gumbel paper.
The results are verified using ONLINE GUMBEL.
The comparison is shown on the table. The mean of the absolute value of the differences between hand-calculated and online results is 1.3 cfs.