Steps:
- Create a graphic using Microsoft Excel or any other software.
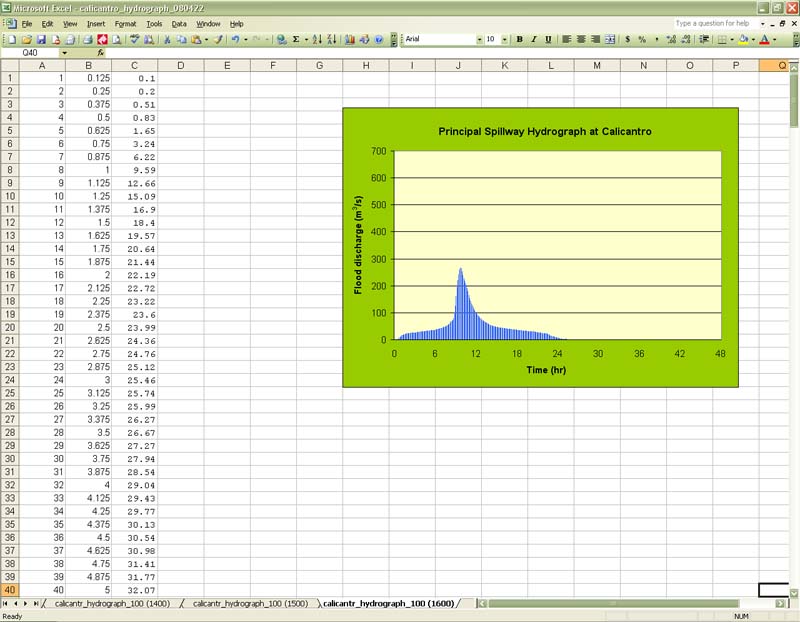
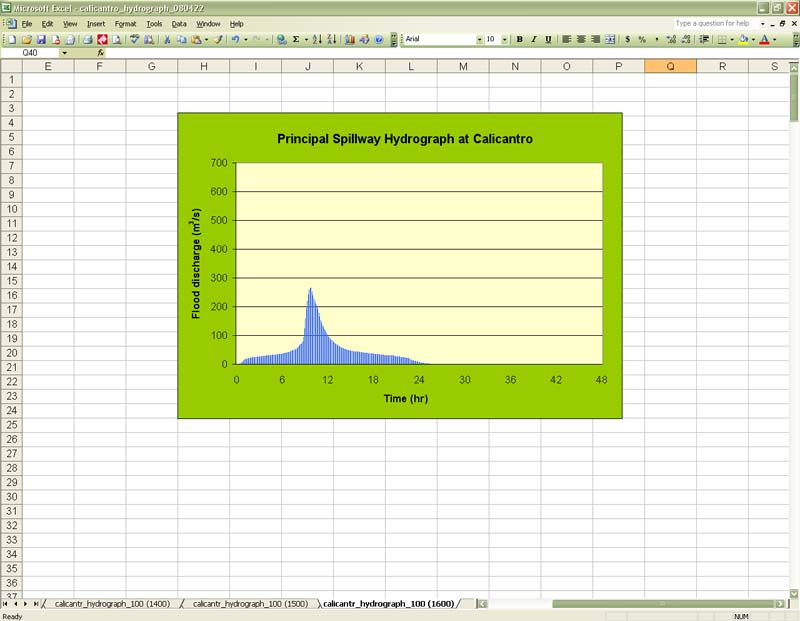
- Zoom in to the graph.
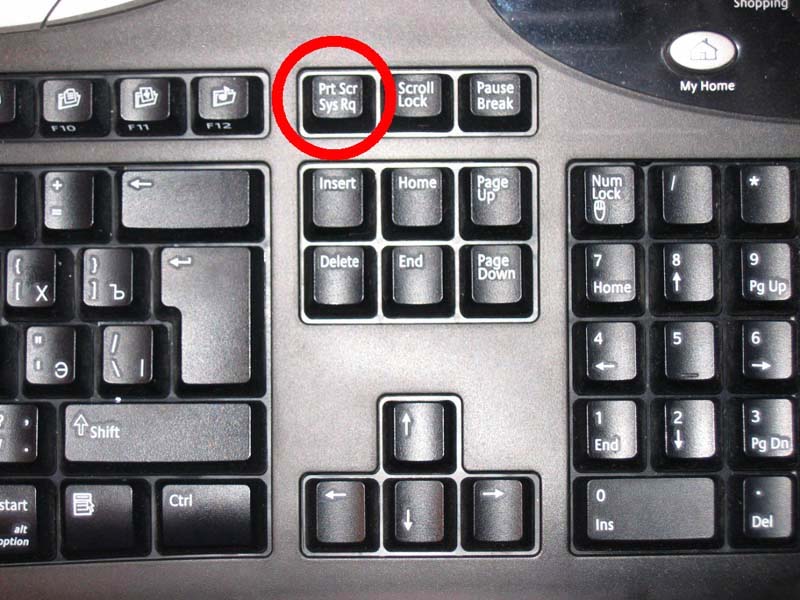
- Press the "PrintScrn" key on your keybord.
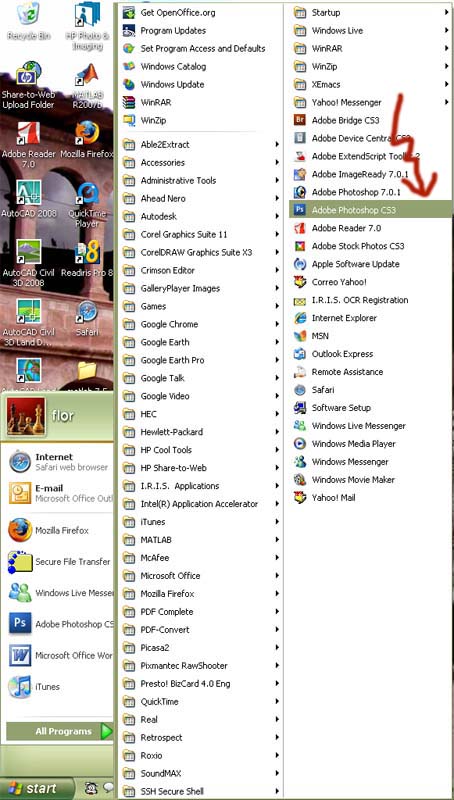
- Open Adobe Photoshop 7.0.1 or CS3.
- Once Adobe Photohop is open, go to the Menu Bar, which is on top of the window and click on "File ---> New"
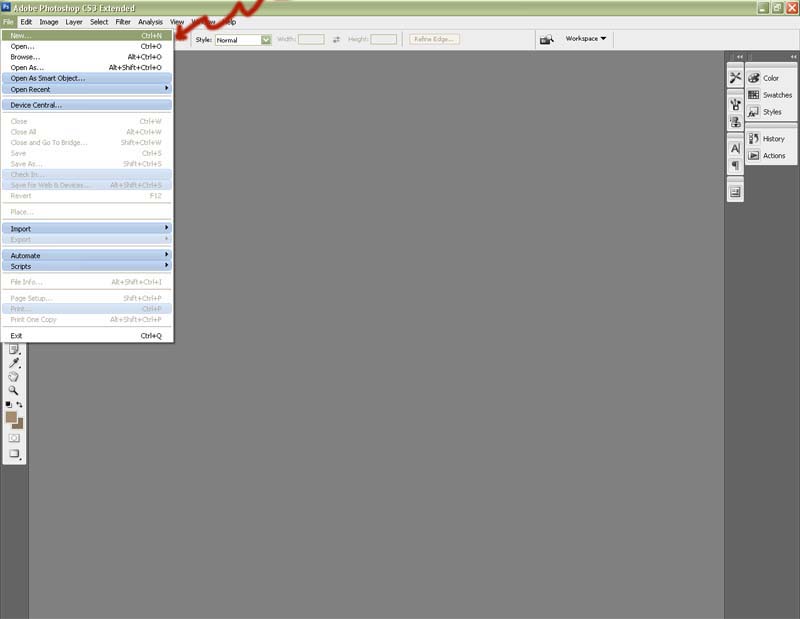
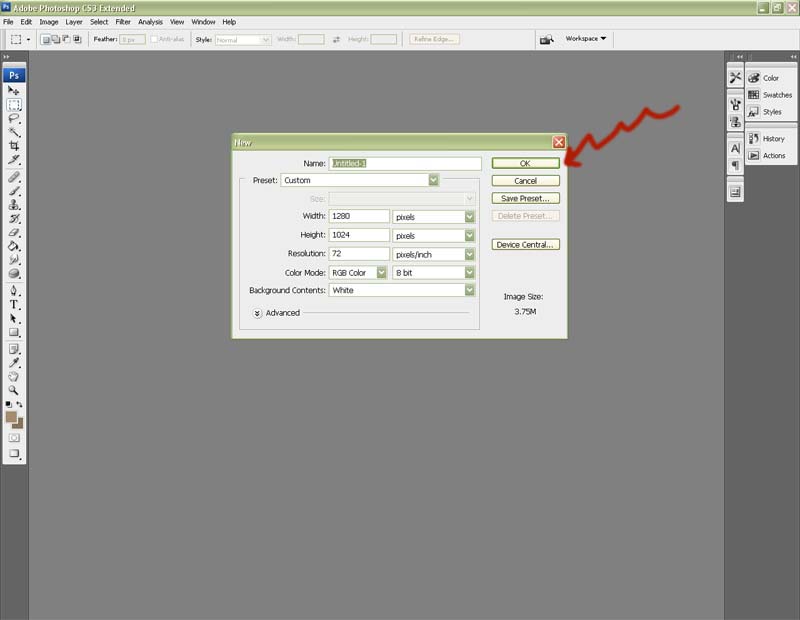
- Click on "OK" to accept the new document
- Press "Ctrl+V" keys to paste the graph image from Excel on the new Photoshop document.
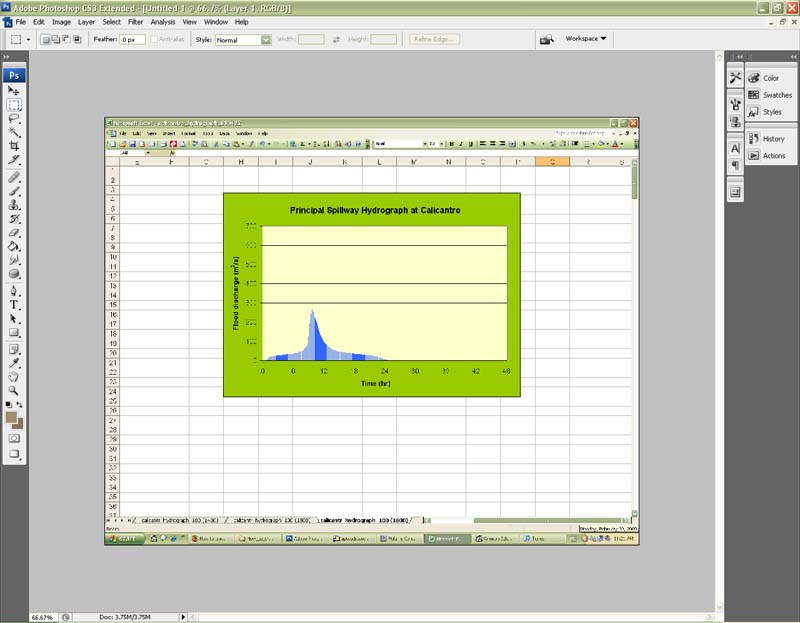
- Zoom in to the graph image, so it will let you see well the area that you want to crop from the Excel image.
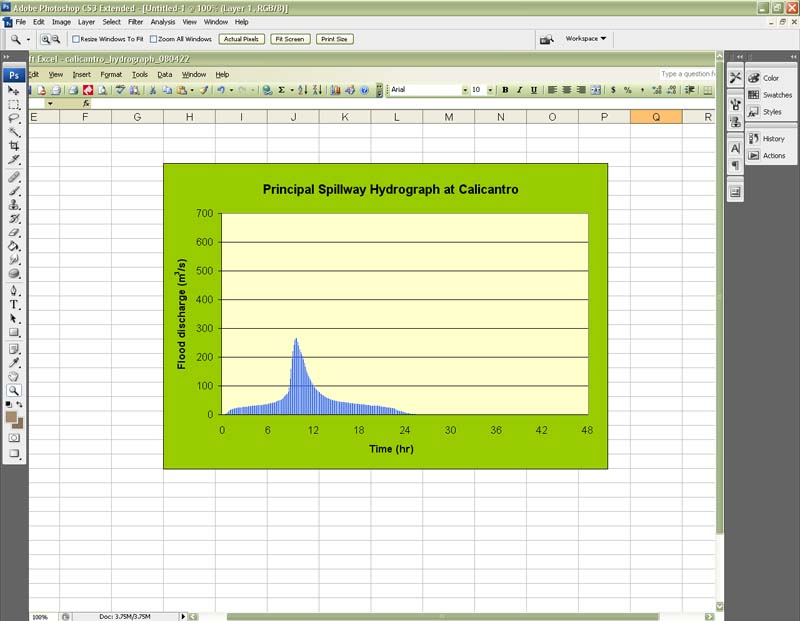
- On the left side of the Photoshop window, there is a "Tool Bar," where you will select the "Rectangular Marquee Tool" (the second tool from the top).
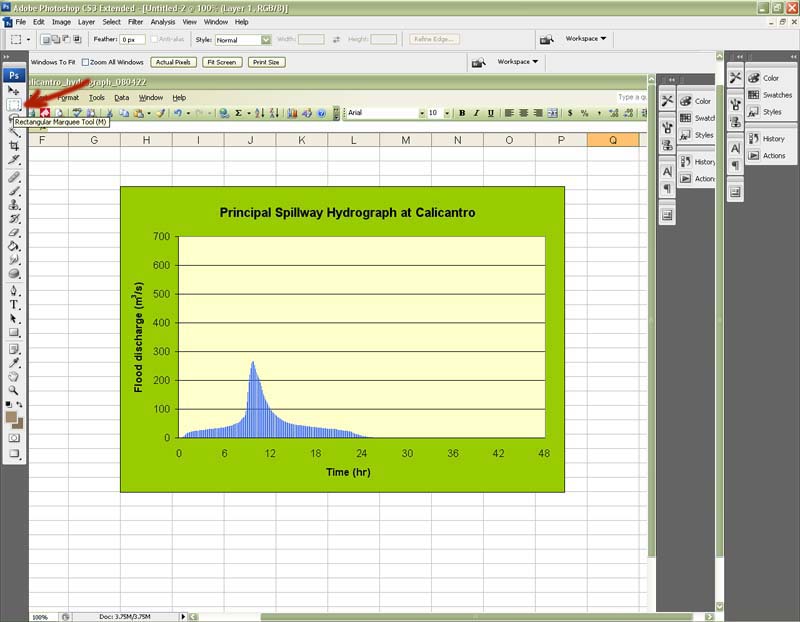
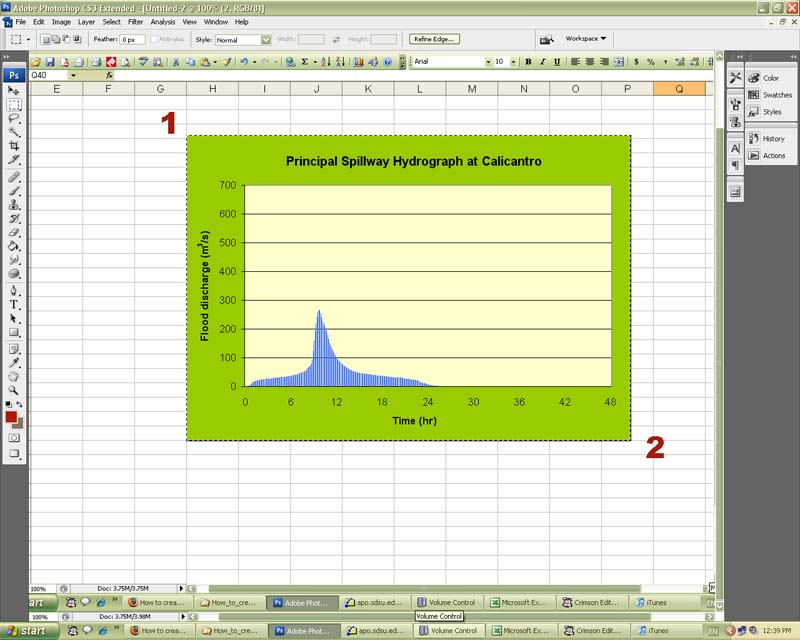
- Once the "Rectangular Marquee Tool" is highlighted, place the mouse at the corner of the graph image, hold, and drag it from
number "1" to number "2." Then, you will see the "marching ants" around the selected area.
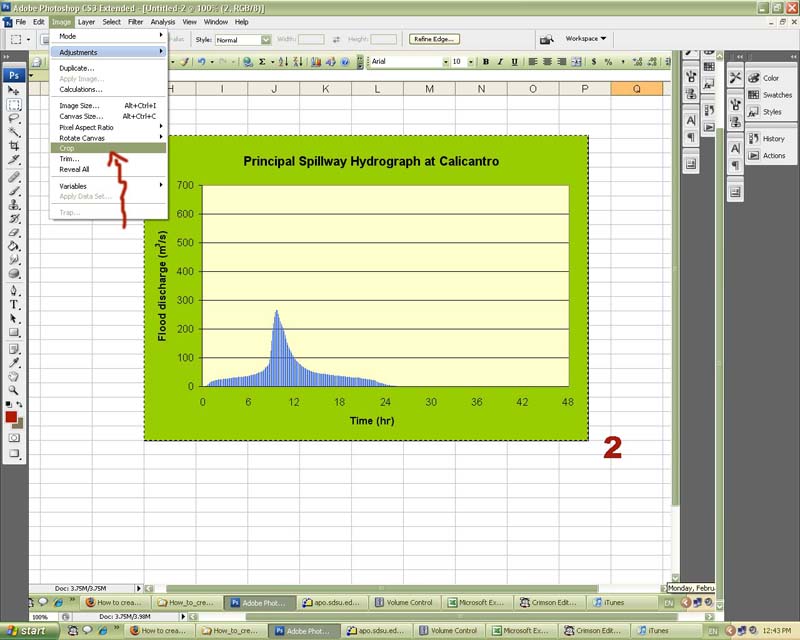
- Click on Image from the Menu Bar and select "Crop"
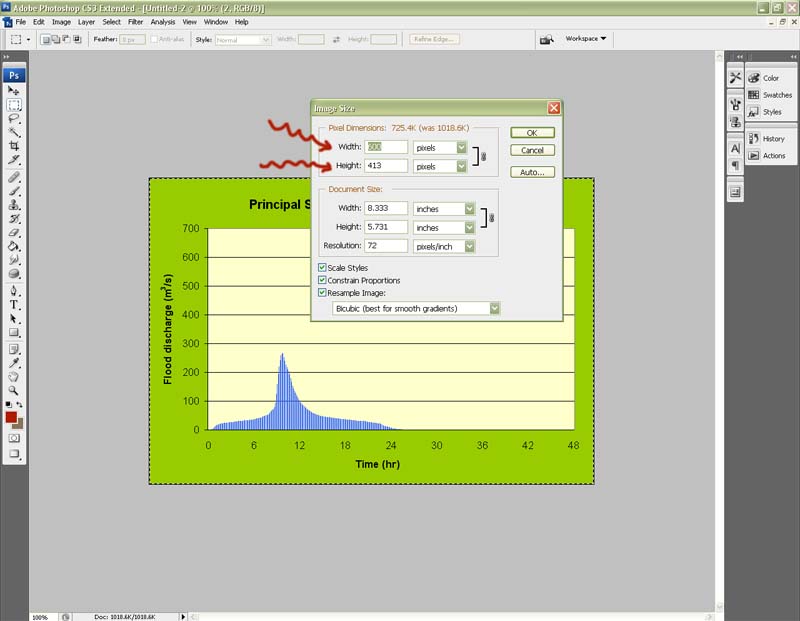
- Click on Image from the Menu Bar and select "Image Size."
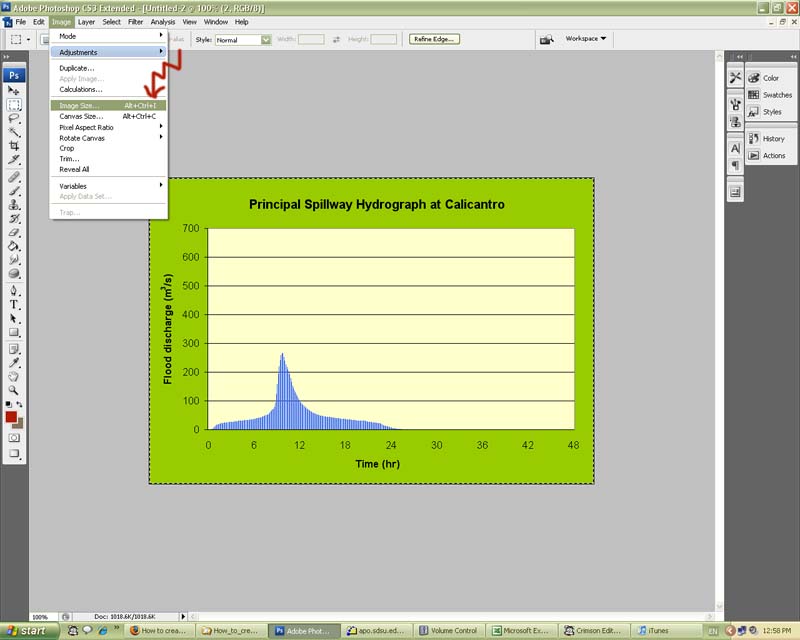
- A window will be open, and you will enter the pixel dimensions for the image. Then, click OK.
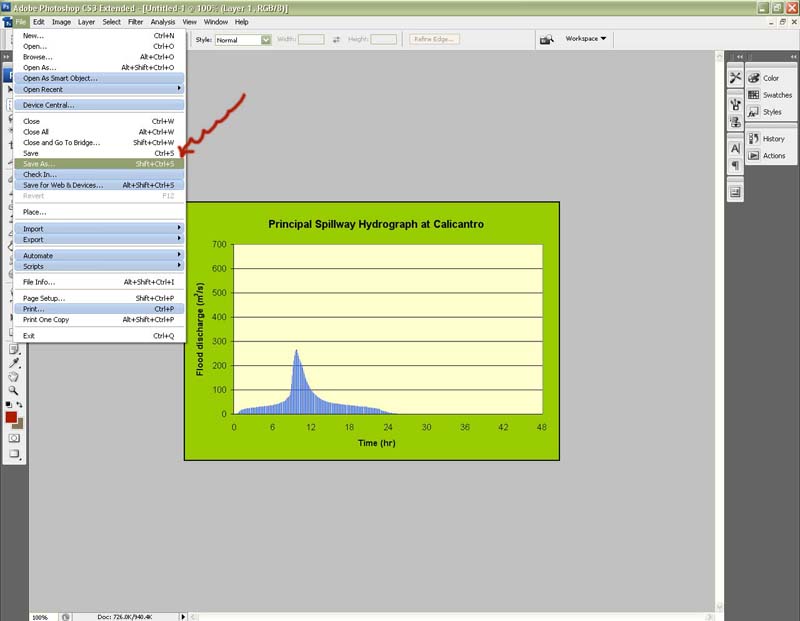
- Click on File from the Menu Bar and select "Save As."
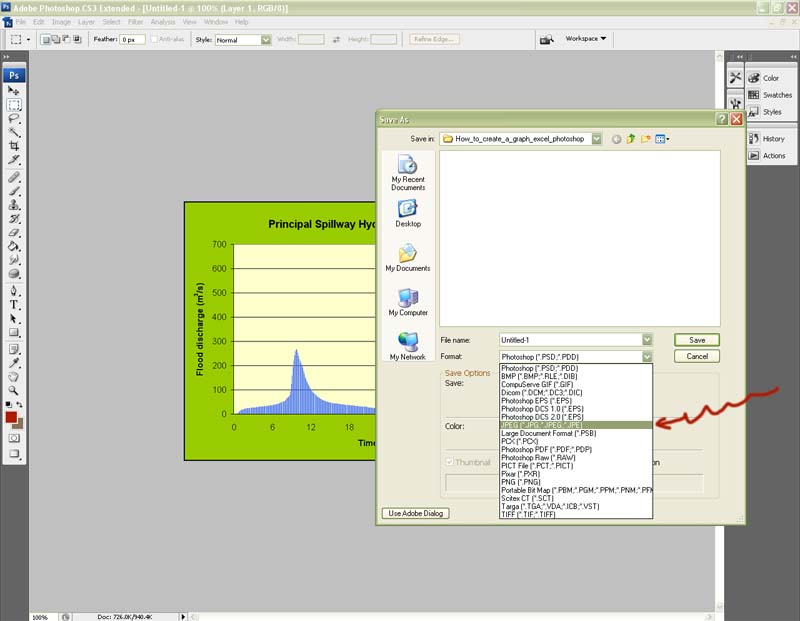
- Select "JPG" format, introduce the file name, and save it.
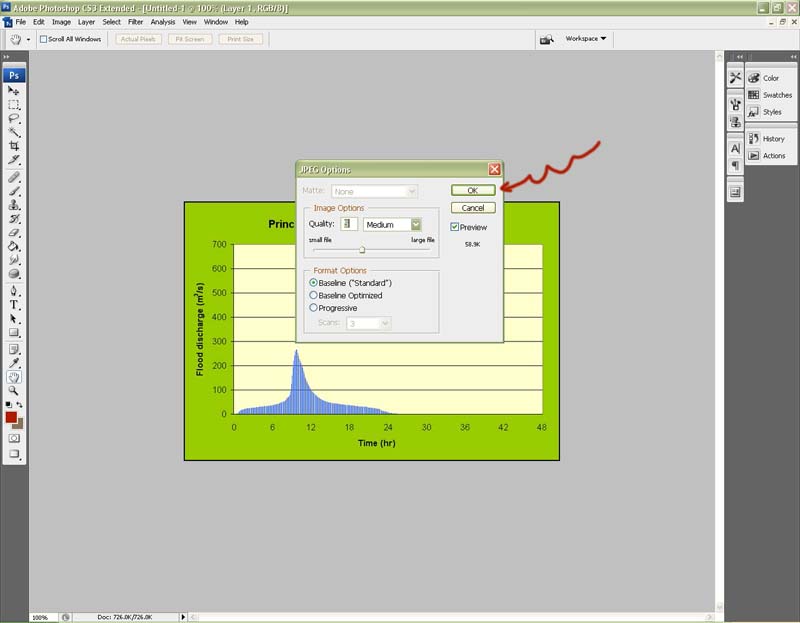
- Then, it will appear a JPEG Options window, where you will select "OK."
|