Skip Navigation Links
1. ORIGIN OF OCEAN SALT The total amount of water in the world has been estimated at 1,500,000,000 km3.1 Of this total, about 97%, or 1,455,000,000 km3, corresponds to the oceans. The oceans contain dissolved salts at concentrations averaging 35 kg per m3 of seawater. Thus, by weight, the total amount of salt in the oceans is about 50 × 1015 metric tons, an enormeous quantity by any measure.2 Scientists are not sure of the source of all this salt, but it is generally agreed that most of it must have originated as constituents of the terrestrial rocks (i.e., in the lithosphere), degraded in geologic time, and transported to the oceans by the flow of streams and rivers.3 Of all salt ions dissolved in the oceans, sodium (Na+) and chloride (Cl-) alone account for about five out of six parts (5/6) (by weight). In elemental form, both sodium metal (Na) and chlorine gas (Cl) are highly reactive; however, when combined into the compound sodium chloride, the latter turns out to be highly stable.
The primary industrial application of sodium chloride is for the transport and marketing of its
constituents.
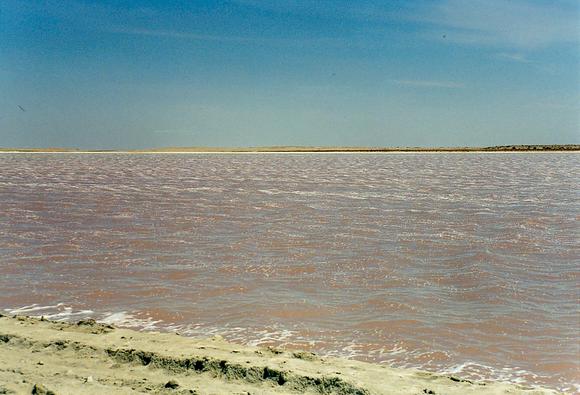
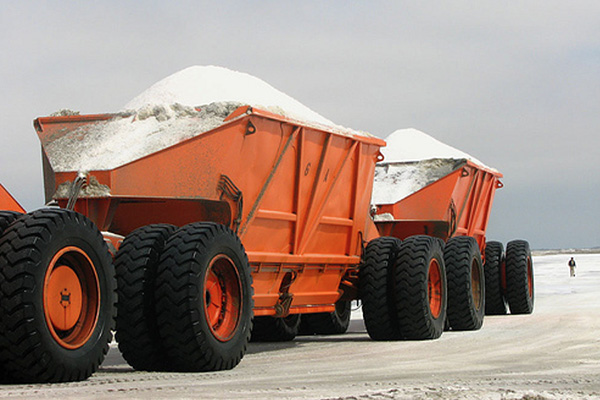
Large quantities of sodium chloride
are extracted from ocean water and salt lakes
for use as raw material for the production of chlorine gas (Cl)
and sodium hydroxide (caustic soda)
2. NATURE OF SALT
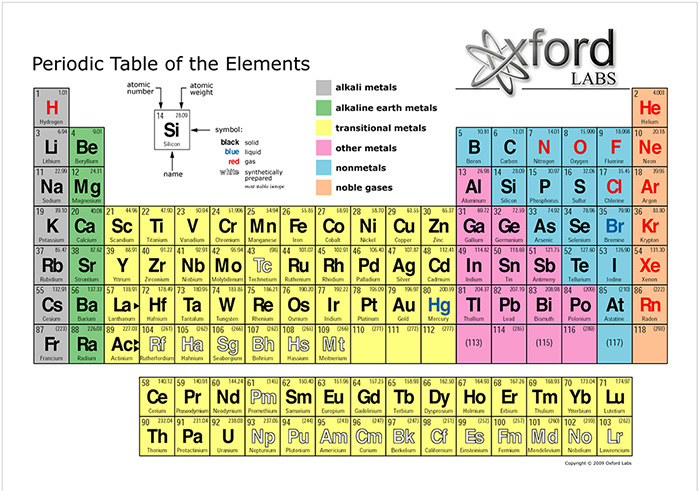
Salts are chemical compounds that originate in the reaction of an acid and a base. They are composed of cations (positively charged ions) and anions (negatively charged ions), such that the combination is electrically neutral. Salt ions may be inorganic or organic. The most common inorganic salt cations are sodium (Na+), magnesium (Mg+), potassium (K+), and calcium (Ca+). These ions are grouped together by atomic number in the Periodic Table of the Elements. Their atomic numbers are 11, 12, 19, and 20, respectively, near the top left of Fig. 2.
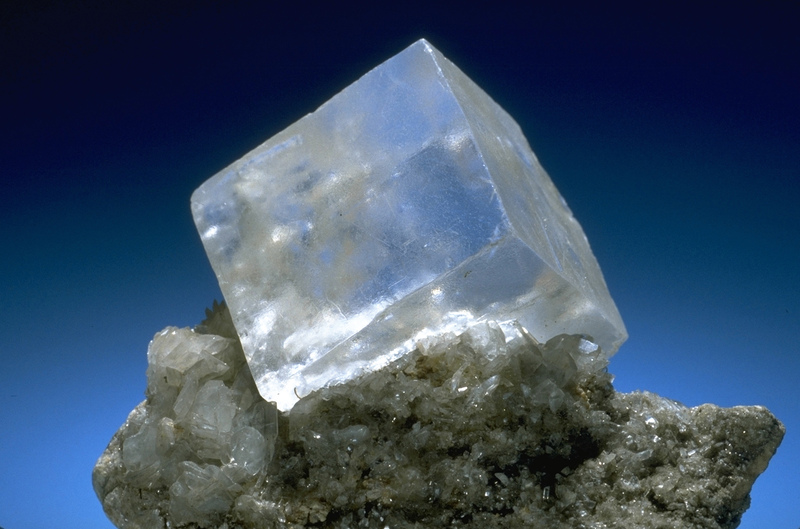
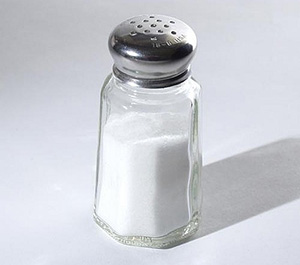
The most common inorganic salt anion is chloride (Cl-), with atomic number 17; the other inorganic elemental salt anion is flouride (F-), with atomic number 9 (Fig. 2). Sodium and chloride are by far the most abundant salt ions in the (ocean part of the) hydrosphere.4 In its mineral state, sodium chloride is referred to as halite; in common usage it is called table salt (Fig. 3).
3. SOURCE OF SALTS Nature is composed of four spheres: (1) biosphere, (2) lithosphere, (3) hydrosphere, and (4) atmosphere. These interact with each other to form the ecosphere, the sum total of Nature, encompassing all living and non-living things. The lithosphere contains the four most common inorganic salt cations (Na+, Ca+, Mg+, and K+) in sizable quantities; however, it contains only very small amounts of the elemental salt anions (Chloride Cl- and Fluoride F-).4 Thus, for salt compounds to form, the anions must be supplied by [at least one of] the other spheres. Chloride is amply supplied by the hydrosphere.4 Chloride is also supplied in minute quantities (aerosols) by the oceans to the atmosphere, eventually to return to the hydrosphere through precipitation. Table 1 shows the relative presence of the four most common salt cations in the lithosphere. The two largest ionic components of the lithosphere are oxygen (O-) and silicon (Si+), at 60.4 and 20.5% of atoms, respectively. The inorganic salt cations (Na+, Ca+, Mg+, and K+) constitute 2.49, 1.88, 1.77, and 1.37%, of atoms, respectively, of the lithosphere (Table 1, Col. 3).4 Column 7 of
Table 1 shows that the inorganic salt cations constitute about 11.1%, by weight, of the lithosphere.
This means that for every
What fraction of this amount (111 kg per metric ton) is incorporated into the three other spheres? Sodium is mostly absent from the biosphere and atmosphere, but significantly present in the hydrosphere. Calcium, magnesium, and potassium are present in the biosphere and hydrosphere, but absent from the atmosphere. [Note that nitrogen, an important constituent of the biosphere, is largely absent from the lithosphere, its primary source being the atmosphere].4
After its release from the lithosphere, sodium is entrained only by the hydrosphere,
while calcium, magnesium, and potassium are taken up by both biosphere and hydrosphere.
Ostensibly, sodium is not taken by the biosphere in any appreciable quantity,
compared to the other salt cations.4
These observations are summarized in
There is ample evidence to suggest that significant amounts of potassium and magnesium are taken up by the terrestrial biosphere, while most calcium and sodium are released by the biosphere, only to join the continental hydrosphere. Potassium ions are essential for the functioning of all living cells. One atom of magnesium lies at the center of every molecule of chlorophyll.4 The hydrosphere is selective in its use of salt cations. Table 3 compares the percentages of ionic salt content in ocean water and river water.2 It is seen that in ocean water the predominant salt ions are chloride (Cl-) and sodium (Na+). On the other hand, in river water the predominant salt ions are bicarbonate (HCO3-), calcium (Ca+), silica (SiO2-), and sulfate (SO4-). Chloride (Cl-) and sodium (Na+) are next on the list, also with significant percentages. There are various reasons for this selectivity. Bicarbonate and sulfate show up in river water as the main products of biodegradation. Calcium and sodium show up in river water because they are not significantly used by the biosphere, which wastes the surplus calcium and sodium by leaching them into river water. Potassium and magnesium also show up in river water, but at smaller percentages that calcium and sodium.
Tables 4a to 4c show the percentage of the four most common salt cations in: (a) the lithosphere, (b) river water, and (c) ocean water, respectively. It is seen that the presence of potassium and magnesium in the lithosphere is much greater than their presence in river water. Calcium appears to be little affected by the biosphere, and the same follows for sodium. As a result of the biospheric sequestration of potassium and magnesium, the quantity of inorganic salt cations actually delivered to river water is much less than that in their lithospheric source. A value of 50% may be considered a rough estimate of the percentage of lithospheric salt cations delivered to river water. This would mean that about 55 kg of salt cations are delivered to river water for every metric ton of weathered/eroded rock, a sizable quantity by any measure. By comparison, the burning of one metric ton of organic matter produces only about 12 kg of ash minerals.4 This underscores the different chemical nature of hydrosphere (river water) and biosphere.
While both calcium and sodium are wasted by the terrestrial biosphere, justifying their presence in river water, the absence of dissolved calcium in ocean water (Table 4c) requires further justification. The contradiction is resolved when it is realized that the oceanic biosphere is actually a sink for calcium, which is employed by a variety of marine organisms for the construction of shells and skeletons.2 Table 5 summarizes the findings of Table 4. The only inorganic salt cation that remains in solution in the oceans is sodium. There is no biological process known to remove sodium ions from the oceans.2 Together with chloride, a constituent of the hydrosphere, these two ions represent 85.7% of all dissolved solids in ocean water (the sum of the first two lines of Col. 3, Table 3). The extremely high solubility of sodium chloride in water, the highest of any known substance, all but guarantees that once dissolved in river water, sodium chloride remains in solution as it reaches its terminus in the oceans and for all time beyond.
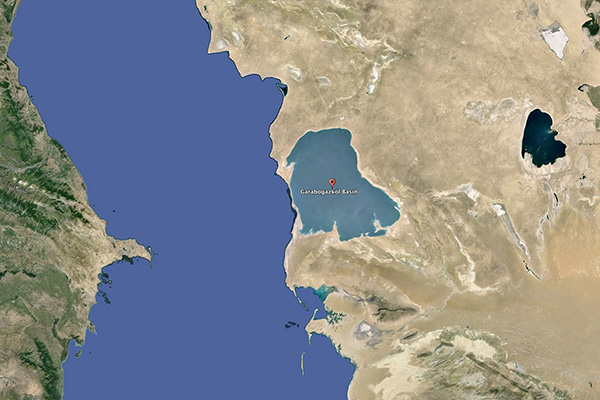
4. THE RIGHT OF NATURE The source of salt ions having been established and their fate clarified, it is concluded that Nature (in this case, the terrestrial biosphere) has reserved for itself the right to dispose of its salt waste. Calcium and sodium cations are largely wasted by the terrestrial biosphere, since, like any other waste, they are supplied in quantities far exceeding the actual demand. After reaching the ocean, calcium is used up by marine organisms, leaving sodium--and chloride, its ubiquitous partner--as the only true wastes of Nature. In peripheral continental drainages, with exorheic (outbound) flows, streams and rivers serve the purpose of flushing the surplus salts to the ocean. This fundamental right of Nature has been exercised since the beginning of time.3 Exorheic drainage basins, typically located in the periphery of continents, are effectively able to flush their salts to the ocean. On the other hand, endorheic drainages, often located in the interior of continents, are unable to flush their salts and, instead, accumulate them in geologic time. Whether a given basin is exorheic or endorheic will depend on continental location and local/regional geomorphology.5 What is certain is that fully exorheic basins are effectively in salt balance, with no net accumulation of salts, while endorheic drainages are not. In general, endorheism accumulates salts, discouraging the development of diverse ecosystems and thus, hampering life. Conversely, exorheic drainages flush the surplus salts, enabling them to continue to support normal life in its myriad of forms. The larger the continental mass, the greater the chance for endorheism (Fig. 4). Yet, exorheic drainages have a clear advantage over endorheic ones with regards to salt balance.
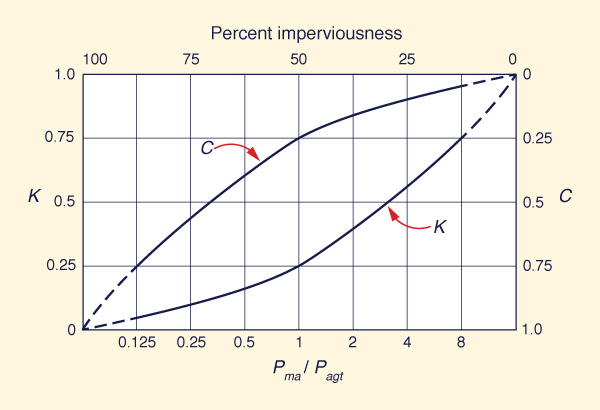
In summary, for peripheral continental basins, rivers serve the purpose of delivering the unwanted salts to the ocean, where they are to remain out of sight and out of mind. In this context, rivers are seen to be natural exporters of salt to the ocean.3 The reduction of river flow by anthropogenic withdrawal (and its eventual conversion to evaporation through irrigation) has the effect of gradually changing an exorheic drainage into an endorheic one, thus compromising the natural salt balance. Yet, this is precisely what that humans have been doing in recent times, particularly during the past century. 5. THE DESIGN OF NATURE The hydrologic cycle is the primordial engine of Nature. It consists of three fluxes: (1) precipitation, (2) evaporation, and (3) runoff. After it hits the ground surface, precipitation separates into runoff and evaporation. Through runoff, water is returned directly to the ocean, where it originated; through evaporation, water is returned to the atmosphere, shortcutting the hydrologic cycle. On a global annual basis, about one-third of precipitation shows up as runoff, while the remaining fraction (about two-thirds) is converted to water vapor and returned to the atmosphere. On an annual basis, the ratio of runoff to precipitation is referred to as the yield runoff coefficient K. This coefficient varies widely, from as little as K = 0.02, to as much as K = 0.93 in highly unusual cases.7 The yield runoff coefficient K must not be confused with the event runoff coefficient C which is used in urban hydrology. While K is a function of climate, C is a function of degree of imperviousness of the watershed in question. Figure 5 shows an approximate conceptual model of runoff coefficients, wherein K is a function of Pma/Pagt, the ratio or mean annual precipitation to annual global terrestrial precipitation. The latter is approximated as Pagt = 800 mm, or 32 in.8
Nature designed the hydrologic cycle so that evaporation and runoff would share in the precipitation. In one extreme, for K = 0, runoff is zero and evaporation is at a maximum; it follows that there is no natural means to flush the salts out of the drainage basin. Thus, salts accumulate without limit, substantially impairing life processes and limiting ecosystem diversity. This is the case of the endorheic basins, typically located in the interior of continents, particularly where runoff has not been able to find an outlet to the nearest ocean. The end result is a salt desert, where life is limited, not only due to lack of water, but also to the endless accumulation of salt. [An extreme example of anthropogenic endorheism is that of the Salton Sea, in California, where a salt lake has been created over the past 80 years by the collection of agricultural drainage in a naturally occurring depression, the Salton Sink. Salts continue to accumulate in the Salton Sea, with no apparent end in sight].9 On the other extreme, for K = 1, evaporation is zero and runoff is at a maximum. Under this scheme, the system is clearly unable to sustain any vegetation. Vegetation requires a constant supply of moisture in order for vascular plants to maintain turgor and thus, avoid wilting. The end result is also a desert, since there is no possibility for the establishment of vegetation. The foregoing cases are unrealistic extremes, presented here only for the sake of discussion. In actuality, Nature splits the water made available by precipitation into two distinct fractions: one for evaporation, and another for runoff. The actual amounts depend significantly on climate, but also on local and regional geology, geomorphology, and continental location.
Where runoff is more than the average, vegetation tends to cover the entire ground surface; thus,
evaporation proceeds through two paths: (1) through vegetation (evapotranspiration) and (2) from
water bodies (Fig. 6). In this case, a typical range is about
Conversely,
where runoff is less than the average, vegetation does not cover the
entire ground surface; thus, evaporation proceeds through three paths: (1) through vegetation (evapotranspiration), (2)
from water bodies, and (3) from bare ground (Fig. 8). In this case, the typical range
is about
Following Nature's design,
central values of K are more conducive to ecosystem health and ecological diversity.
For K ≅ 0,
the system is stressed
due to lack of runoff and an excess of salts.
For K ≅ 1, the system is stressed due to too much runoff and a patent lack of vegetation.
In theory, the ideal
partitioning of precipitation should correspond to
The preceding discussion has posited that very low runoff coefficients (K ≅ 0)
are very much the exception in naturally exorheic landscapes.
A basin with very low runoff coefficient generally leads to salt accumulation,
since the scarce runoff is insufficient to carry all the salts away.
Basins with significant human settlement
typically feature yield runoff coefficients in the range
6. THE DESIGN OF HUMANS In recent times, but more so over the past one hundred years, humans have tended to settle semiarid and arid lands, where the available water may be insufficient to satisfy all needs, including natural and anthropogenic. The natural needs are those of the prevailing ecosystem, which requires water for its normal functioning. The anthropogenic needs are those imposed by human settlement, demonstrably for food and fiber, but also for domestic and industrial uses. For instance, the limit between semiarid and arid regions is 400 mm (16 in) of mean annual precipitation.8 This should correspond roughly (in a fully exorheic basin) with a yield runoff coefficient K around 0.2. Often, this amount of water proves to be insufficient to satisfy all perceived needs. An anthropogenic use of water is its consumptive use in irrigation, to grow additional food and fiber to satisfy the evergrowing demand. Natural ecosystems are first in line to take up their share of water through evaporation and evapotranspiration; threfore, this amount is already committed. For humans, the only recourse has seemed to be the conversion of runoff to evapotranspiration by way of irrigation. This produces more food and fiber, but at the cost of reducing the yield runoff coefficient (the consumptive use water in irrigation has to come from somewhere!). Effectively, the additional food and fiber realized has decreased the capacity of the basin to flush its salts.
There are those who argue that runoff water is too precious to waste it in the oceans.
Under this misguided optic,
every drop of water that goes into runoff must be stored and destined for economic uses.
Irrigation is particularly worrisome, because if developed without limit, it leads
to the eventual disappearance of all runoff.
In effect, when all runoff is converted to evaporation, the yield runoff coefficient
reduces
to zero, setting the stage for the takeover by a salt-infested desert
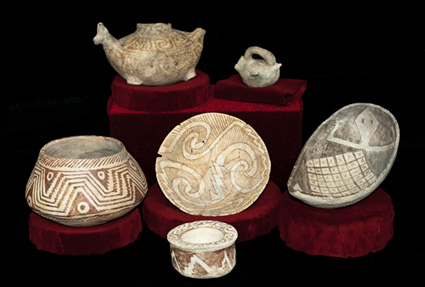
The solution is to limit, through appropriate regulation, the anthropogenic conversion of runoff to evapotranspiration. It is seen that in semiarid and arid regions, where irrigation is most needed, the production of food and fiber results in less runoff, when in actuality, more runoff is required to successfully accomplish the removal of the extra salts. A lesson to be gleaned from the historic record is that of the little-known Hohokam civilization, which flourished in central Arizona for more than 1,200 years, until its unexplained disappearance about 1,450 A.D. (Fig. 10).10 Floods, droughts, and salt accumulation have been used in an attempt to rationalize the demise of the Hohokam, which, quite fittingly, in the local Pima language means "those who have vanished."11 Salinity may stand out as the most likely culprit, since floods actually enrich the soil with fresh nutrients and droughts are often temporary. Moreover, salinity is pervasive and difficult to manage, particularly in an arid environment such as that of central Arizona.
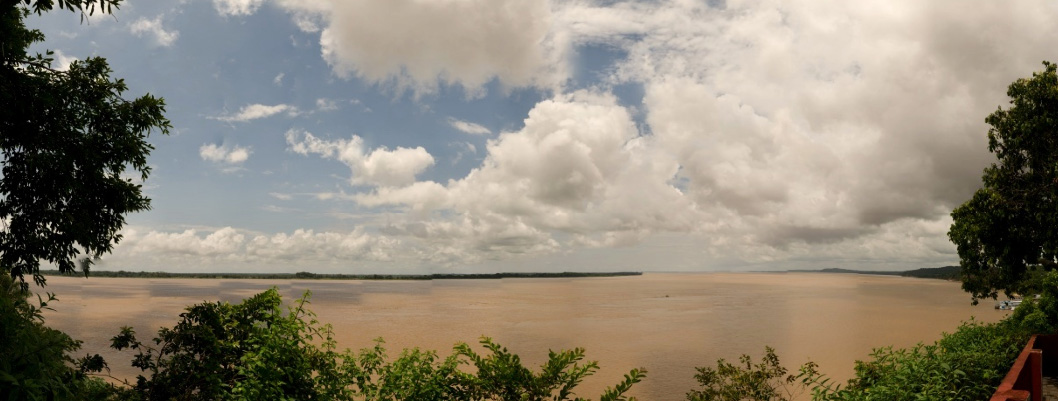
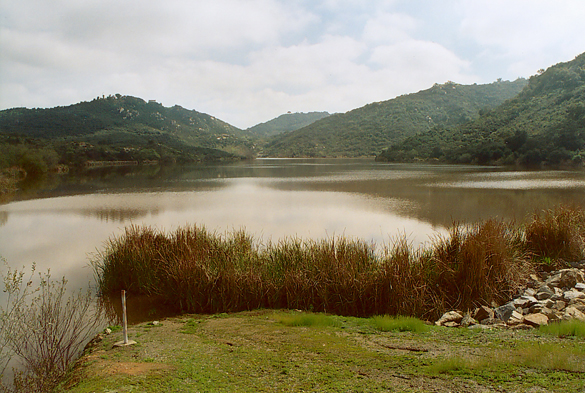
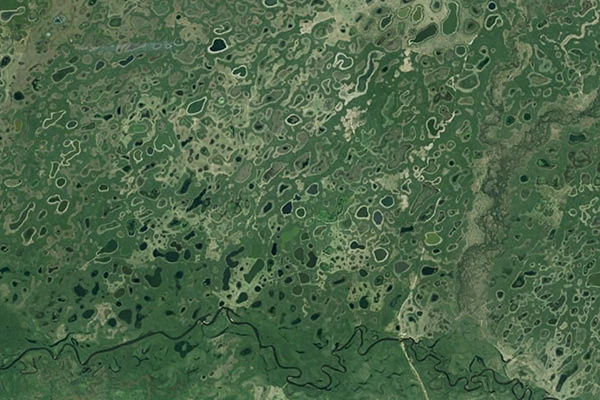
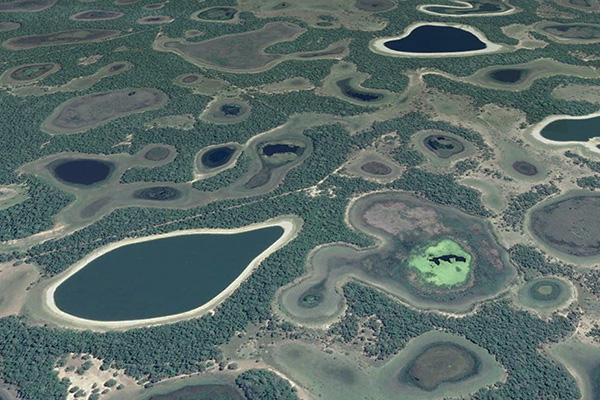
Over the past two decades, the sustainability of irrigation has been thoroughly examined, notably by the ASCE Manual of Practice No. 71.12 On one side of the argument, there are those who advocate the return to dryland farming, which entails the abandonment of irrigation as a desirable human enterprise. The problem began with the settlement of arid lands, which humans may have pursued earnestly in their search for more land, health and sun. Barring the undoing of the settlement of arid lands, which at this juncture seems politically unrealistic at best, the only feasible course to take is the regulation of irrigation. It makes practical sense to reserve a portion of the runoff for the avowed purpose of flushing the salts out of the basin.13 This appears to be the only sustainable course to take. 7. ON BASIN SALT BALANCE The concept of basin salt balance helps explain the conflict between the design of Nature and that of humans. Nature intended for fully exorheic basins to be in salt balance, i.e., no net salt accumulation over time. On the other hand, endorheic basins are not in salt balance, undergoing a continuous process of salt accumulation over geologic time. It is important to note that the actual drainage pattern may not be always clear cut. In some cases, heeding local geomorphology, basins may be semiendorheic or semiexorheic, depending on which process, salt collection or salt flushing, is more prevalent, and to what extent. For instance, the Upper Paraguay river basin, located near the geographical middle of South America, is, for all intense and purposes, an exorheic basin, featuring a mean annual outflow of 1,565 m3/s at its mouth, the confluence with the Apa river, in Mato Grosso do Sul, Brazil.14 Yet, the demonstrated presence of salinas, or salt ponds, in some places, shows that not all areas of the basin are connected to the main drainage system (Figs. 11 and 12).15 In fact, the Upper Paraguay basin, while appearing to be in regional salt balance, may actually not be in local salt balance. Thus, in large subhumid basins of continental-delta character like the Upper Paraguay, local geomorphology is seen to play a crucial role in conditioning endorheism.
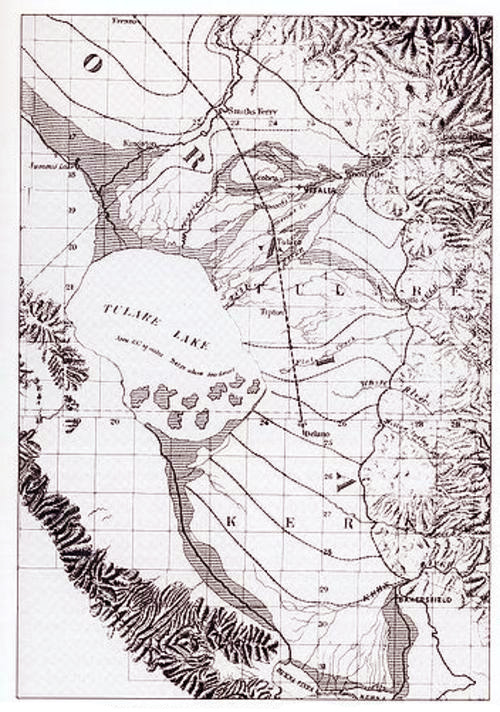
The choice between exorheism and endorheism is clear. Since salts generally end up degrading natural ecosystems, particularly in arid/semiarid regions, exorheic basins are to be preferred over endorheic ones. Preserving or conserving a basin's salt balance--presumably as close to pristine as is realistically possible--must be the overriding goal of sustainable basin management. The example of the Inland Empire Brine Line, in the Santa Ana river watershed, in California, shows that the goal is achievable.16 In this case, the basin's peripheral continental location clearly favored the salt balance objective. 8. THE CASE OF TULARE LAKE BASIN A historic if somewhat extreme example of anthropogenic runoff (and salt) sequestration is that of Tulare Lake Basin, located near the southern tip of California's Central Valley. In the 1840s, at the onset of contemporary settlement in the area, Tulare Lake was the largest freshwater lake west of the Mississippi river, and the second largest in the U.S., based on surface area. At the elevation of 216 ft (66 m), its highest overflow level, recorded in 1862 and 1868, Tulare Lake spanned 790 square miles (Fig. 13).17
Through most of the 1800s, Tulare Lake functioned as a semiendorheic basin, collecting its own local and regional runoff from the South Fork Kings, Kaweah, Tule, and Kern rivers. During periods of infrequent flood, at elevations above 207 ft (63 m), Tulare Lake would overflow northward, through Fresno Slough, into the San Joaquin river basin, flushing away a portion of its salts. During the 29-year period of 1850-1878, Tulare Lake overflowed 19 times. The total outflow during that period is estimated to be 1,055,000 acre-feet.17 No overflows occurred after 1878 due to increasing diversions of tributary flows for irrigation and municipal water uses. By 1899, the lake had dried up, except for residual wetlands and occasional floods. Irrigation development in Tulare Lake Basin has effectively meant that for about the past 140 years all runoff has been retained within the lake confines and with it, all salts. In addition to the salts already present in normal amounts in natural runoff, the irrigation of arid lands effectively creates new waste salts (of calcium and sodium) by disaggregating the geologically relative young soils to extract the useful salts (magnesium and potassium).18 Thus, irrigation development represents a double whammy: Less runoff available to transport the regional salts, and more salt produced locally.
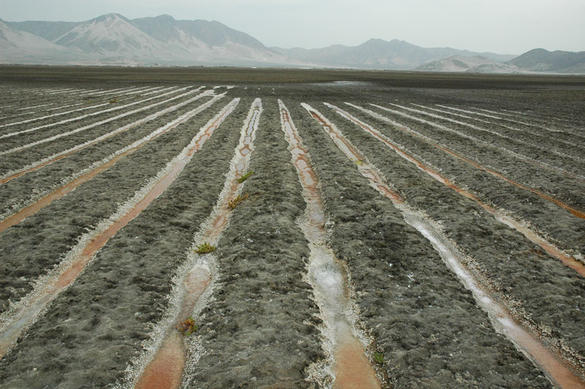
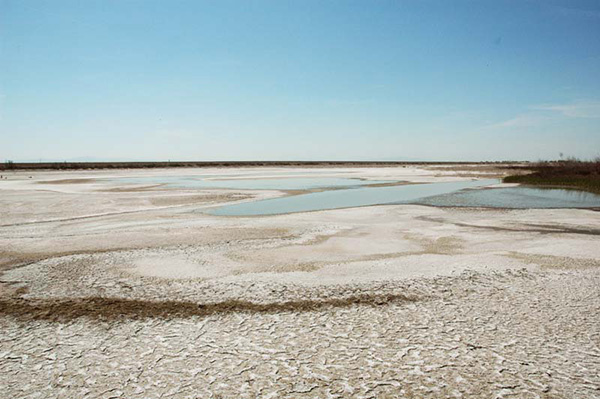
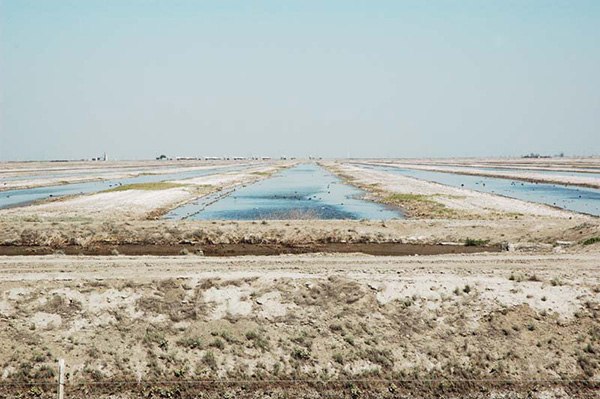
In Tulare Lake Basin, salts are being stored in evaporation basins
(Fig. 14). In order to handle the
increasing amounts of salt, artificial waterfowl habitat has
been implemented in the past several years
Pillsbury (1981), for one, has presented a bleak picture of the aftermath of salt collection in evaporation basins.3 He states, to wit:
The trade-offs of extensive irrigation development, particularly of arid lands, are patently clear. More food and fiber will be produced, but at the cost of additional salts, which will require appropriate disposal. Lack of proper salt management will render the irrigation system unsustainable in the long run. As Pillsbury has adroitly pointed out, it is a matter of time before the system will begin to show its cracks. The case of Tulare Lake basin may be an extreme example of anthropogenic salt sequestration, but it is by no means an isolated one. All irrigation development, particularly that of arid lands, will end up increasing either: (a) the salinity of the downstream flows, or (b) the salinity of the local groundwaters.3 Thus, the tradeoffs of irrigation development must be critically examined. In many cases, when all factors are carefully considered, the feasibility of irrigation development may prove to be elusive.12 9. CONCLUSIONS The following conclusions are derived from this study:
In summary, ions of sodium and calcium are produced by lithospheric disintegration in quantities far exceeding those that could possibly be assimilated by the terrestrial biosphere. In exorheic drainages, the resulting waste has been (and it is being) transported to the ocean by streams and rivers. In endorheic drainages, it has collected in the interior of continents, producing closed salt basins. In general, exorheism is preferable to endorheism because it leads to healthier, more diverse ecosystems. Irrigation development converts runoff into evaporation, reducing the amount of water available for salt flushing. At the same time, particularly in arid and semiarid regions, where it is most needed, irrigation mobilizes new salts through the additional biodegradation of geologically young soils.18 In the limit, when all runoff is sequestered and converted to evaporation, no runoff is left to carry the salts to the ocean. As the system is gradually driven towards this limit, it becomes unsustainable, not for lack of water to support the vegetation, but for lack of water to flush the salts. Heeding hydrologic science, we posit that Nature had a different plan: On the average, two-thirds of the available water for the ecosystem, and the remaining one-third for the flushing of all salts, regional and local (new salts).3 The strategy of retaining most or all runoff, on the misguided grounds that it constitutes "precious" water, could only lead to the eventual conversion of peripheral continental basins into salt-infested artificial basins. It appears most certain that this was not the design of Nature. REFERENCES 1 Penman, H. L. 1970. The water cycle. Scientific American, Vol. 223, No. 3, September, 99-108. 2 Swenson, H. 2015. Why is the ocean salty? U.S. Geological Survey publication. 3 Pillsbury, A. F. 1981. The salinity of rivers. Scientific American, Vol. 245, No. 1, July, 54-65. 4 Deevey, E. S. 1970. Mineral cycles. Scientific American, Vol. 223, No. 3, September, 149-158. 5 Ponce, V. M. 2014. Ecohydroclimatological research: The case for geomorphology. Online article. 6 Railsback, L. B. 2006. Some fundamentals of mineralogy and geochemistry. Online article, Consulted on February 19, 2015. 7 L'vovich, M. I. 1979. World water resources and their future. Translation from Russian by Raymond L. Nace, American Geophysical Union. 8 Ponce, V. M., R. P. Pandey, and S. Ercan. 2000. Characterization of drought across climatic spectrum. Journal of Hydrologic Engineering, ASCE, Vol. 5, No. 2, April, 222-224. 9 Ponce, V. M. 2005. The Salton Sea: An assessment. Online article. 10 Encyclopædia Britannica. Hohokam culture. Consulted on February 19, 2015. 11 Arizona Museum of Natural History. The Hohokam. Consulted on February 19, 2015. 12 American Society of Civil Engineers. 1990. Irrigated agriculture: Is it sustainable? Chapter 28 in Agricultural salinity assessement and management. Manuals and Reports on Engineering Practice No. 71, 1st edition, New York. 13 Ponce, V. M. 2009. Sustainable runoff for basin salt balance. Online article. 14 Ponce, V. M. 1995. Hydrologic and environmental impact of the Parana-Paraguay Waterway on the Pantanal of Mato Grosso, Brazil: A reference study. San Diego State University, San Diego, California. 15 Martins, E. R. C. 2012. Tipologias de lagoas salinas no Pantanal de Nhecolândia (MS). Doctoral dissertation, Universidade de São Paulo, São Paulo, Brazil. 16 Santa Ana Watershed Project Authority. 2012. Inland Empire Brine Line. Consulted on February 15, 2015. 17 ECORP Consulting, Inc. 2007. Tulare Lake basin hydrology and hydrography: A summary of the movement of water and aquatic species. U.S. Environmental Protection Agency. 18 Rhoades, J. D., D. B. Krueger, and M. J. Reed, 1968. The effect of soil-mineral weathering on the sodium hazard of irrigation waters. Soil Science Society of America Proceedings, Vol. 32, 643-647. PDF file: download Adobe Acrobat Reader | ||||||||||||||||||||||||||||||||||||||||||||||||||||||||||||||||||||||||||||||||||||||||||||||||||||||||||||||||||||||||||||||||||||||||||||||||||||||||||||||||||||||||||||||||||||||||||||||||||||||||||||||||||||||||||||||||||||||||||||||||||||||||||||||||||||||||||||||||||||||||||||||||||||||||||||||||||||||||||||||||||||||||||||||||||||||||||||||||||||||||||||||||||||||||||||||||||||||||||||||||||||||||||||||||||||||||||||||||||||||||||||||||||||||||||||||

| 220713 06:00 |