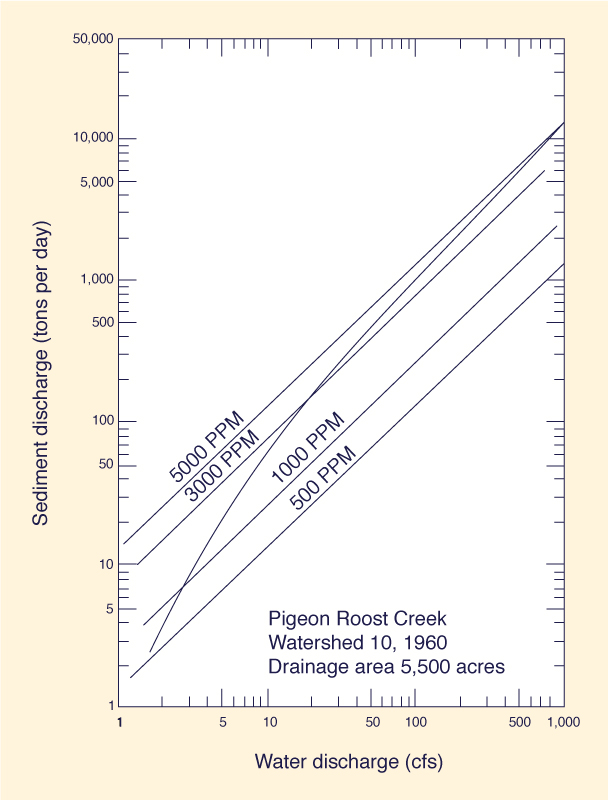
1. INTRODUCTION In engineering practice, the sediment rating curve is used to relate sediment discharge to water discharge, under steady equilibrium flow conditions. The slope of the sediment rating curve is a measure of the suspended bed material sediment concentration. In this paper, the suspended bed material sediment concentration is referred to as sediment concentration, and it specifically excludes wash load. Typically, sediment rating curves plotted in logarithmic scale have large slopes at low discharges and smaller slopes at high discharges, as shown in Fig. 1 (1). For a sufficiently high discharge, the slope of the sediment rating curve approaches asymptotically a value of unity, i.e., a constant sediment concentration. This constant sediment concentration which streams tend to reach at high discharges is herein referred to as the ultimate sediment conoentration. As shown in this paper, the ultimate sediment concentration can be readily calculated as a function of flow and bed material sediment properties. 2. ULTIMATE SEDIMENT CONCENTRATION
In engineering practice, the following power function is commonly used to provide a fit between measured water and sediment discharge data:
in which Qs = suspended bed material sediment discharge, hereafter sediment discharge for simplicity, Q = water discharge, and c and m, coefficient and exponent of the rating, respectively.
In Eq. 1, for m = 1, the sediment concentration is independent of Q and equal to:
in which Cs' = ultimate sediment concentration. The value of m = 1 appears to be a minimum value approached by many streams at very high flood discharges (Ref. 1, p. 476).
A widely used sediment transport formula which is based
on Colby's method (2) is the following:
in which qs = sediment discharge, per unit channel width; v = mean flow velocity; k = (suspended bed material) sediment transport parameter, a function of bed material sediment properties, including mean particle size, gradation, and specific gravity; ρ = density of water; and n = exponent. The value of n is usually in the range 3-7. Colby (2) has shown that high values of n prevail at low water discharges, while low values of n are typical of high water discharges. Since n cannot realistically decrease below 3, the value n = 3 is taken as the exponent associated with the ultimate sediment concentration. In this case, the bed configuration approaches upper regime (e.g., plane bed with sediment movement), in which bottom friction is largely due to grain roughness (5).
With n = 3, Eq. 3 is dimensionally homogeneous:
in which qs = ultimate sediment discharge, per unit channel width, and k is a dimensionless parameter.
The water discharge, per unit channel width, is:
in which d = flow depth.
In terms of discharge per unit channel width, Eq. 2 is recast as:
Substitution of Eqs. 4 and 5 into Eq. 6 leads to:
in which
is the specific weight of water, g = gravitational acceleration, and
is the steady equilibrium flow Froude number.
Equation 7 can be used in either calibration or prediction mode. In calibration mode, the Froude number and ultimate sediment concentration are known, and Eq. 7 is used to solve for the sediment transport parameter k. In prediction mode, the Froude number and parameter k are known, and Cs' = 0.1 × 0.04 x 1,000 g/L = 4 g/L = 4,000 ppm.
An alternate expression to Eq. 7 can be derived by noting that for wide channels, the following expression relates friction (or bottom) slope to Froude number, under steady equilibrium (i.e. uniform flow in the case of artificial channels) flow conditions (3):
in which So = bottom slope, and
in which f = dimensionless Chezy friction factor, and C = Chezy coefficient. Combining Eqs. 7 and 10:
Given Eq. 12, the ultimate sediment concentration can be calculated as a function of the following three dimensionless parameters: (1) sediment transport parameter k,
(2) bottom slope So , and (3) friction factor f. For example, with C = 70 m1/2/s, So = 0.0084, and k = 0.05, the application of In practice, the parameter k is a measure of the flow's ability to entrain and transport bed material sediment. It accounts not only for mean particle size, gradation, and specific gravity, but also for the effect of wash load concentration and water temperature on bed material transport (2). 3. SUMMARY AND CONCLUSIONS Typical sediment rating curves show a trend toward a constant (suspended bed material) sediment concentration at sufficiently high discharges. This maximum value of sediment conoentration can properly be referred to as the ultimate sediment concentration. The ultimate sediment ooncentration is shown to be a function of a dimensionless (bed material) sediment transport parameter and a dimensionless flow parameter (the square of the Froude number). Alternatively, the Froude number squared can be expressed as the ratio of bottom slope and dimensionless Chezy friction factor.
|
| 201029 15:15 |
| Documents in Portable Document Format (PDF) require Adobe Acrobat Reader 5.0 or higher to view; download Adobe Acrobat Reader. |