|
COMPARISON BETWEEN CLARK'S ORIGINAL
AND
CLARK'S PONCE UNIT HYDROGRAPHS
Andrea C. Scott and Victor M. Ponce
[201220]
|
Abstract. The theoretical basis for Clark's original 1945 and Clark's Ponce 1989 methods of catchment routing are explained and compared. It is shown that Ponce's method consistently provides a somewhat longer time base and a correspondingly smaller peak discharge than Clark's original methodology. This is a direct consequence of Ponce's use of a continuous time-area derived unit hydrograph, in lieu of the discrete hyetograph used by Clark. However, the differences in peak discharge are consistent with the methodologies used and do not appear to be significant. |
1. INTRODUCTION
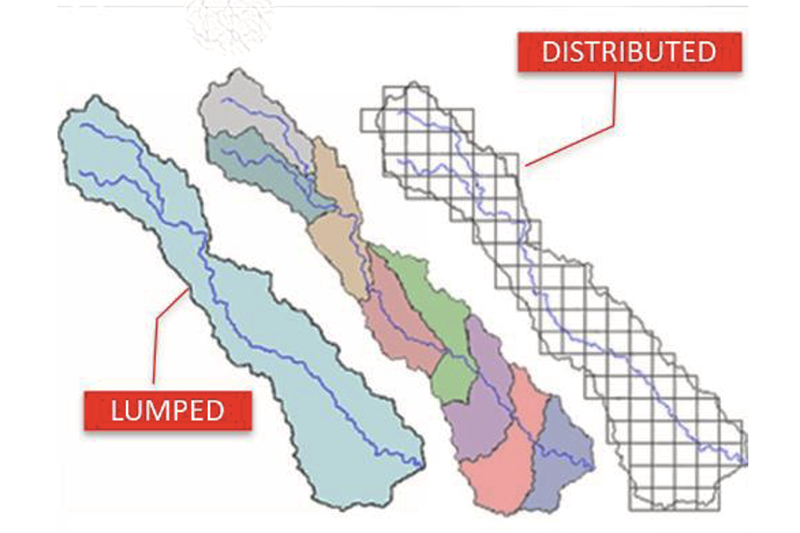
Catchment
routing is the field of runoff analysis
that converts effective rainfall into runoff.
|
| NOAA/ NWS/The COMET Program |
In catchment routing, the components of translation and storage constitute two distinct processes used to transform an inflow hyetograph into an outflow hydrograph. Translation is interpreted as the movement of water parallel to the channel bottom; storage is interpreted as the movement of water perpendicular to the channel bottom. Translation is often referred to as convection or concentration; storage is referred to as diffusion or attenuation.
The Clark model is an established
method for calculating a unit hydrograph
Clark obtained a hyetograph of unit runoff
from the first step and proceeded to route this
hyetograph through a linear reservoir for the second step.
Ponce modified the Clark procedure by obtaining a hydrograph
of unit runoff
out of the first step, and
subsequently routing this hydrograph through a linear reservoir (Ponce, 1989a).
Ponce's procedure provides a slightly more diffused
unit hydrograph,
albeit one that is more consistent with established routing principles.
2. METHODOLOGY
The methodology for developing the first part of a Clark unit hydrograph
resembles that of the time-area method. First, the catchment
is divided into several subcatchments delimited by isochrones,
defined as lines of equal travel time
to the outlet [Fig. 2 (a)].
The resulting subareas are measured and
plotted for each time interval, constituting a time-area
histogram
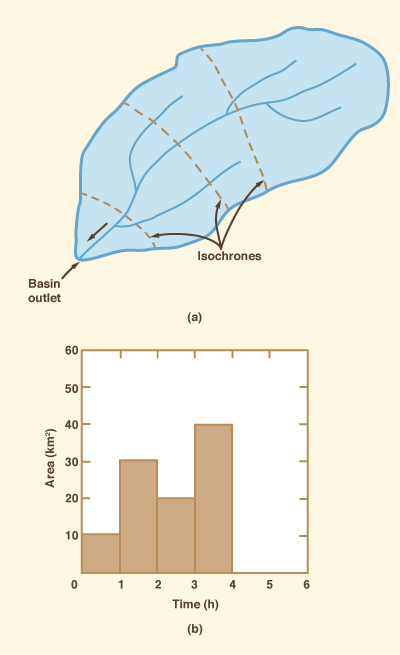
|
and (b) time-area histogram.
The procedure leads to a
hyetograph corresponding to a unit depth of effective runoff.
Despite the lack of diffusion,
a hyetograph/hydrograph developed using the time-area method
has the
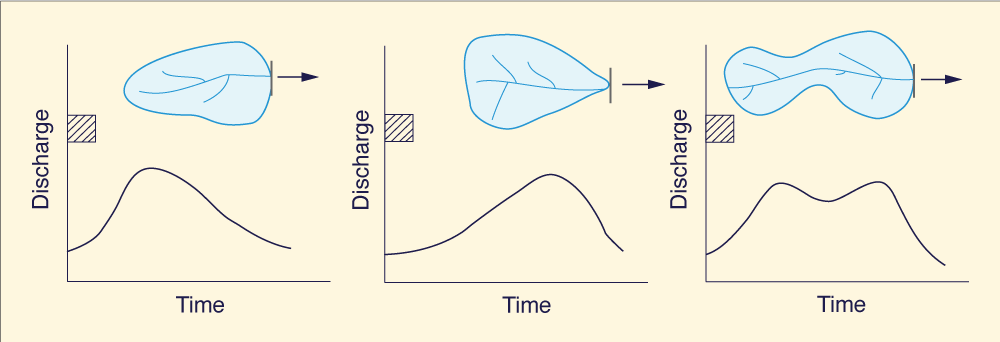
inherent advantage of taking into account the catchment shape.
|
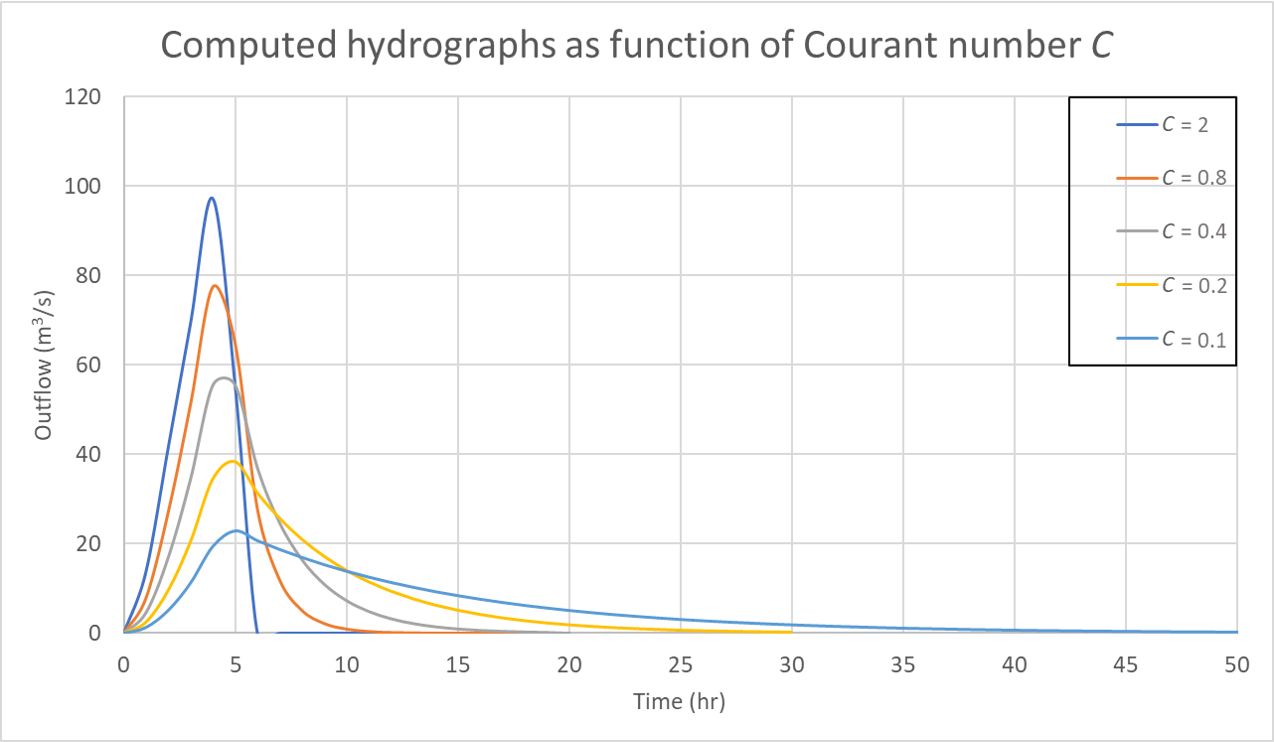
The second part of the Clark method is designed to provide runoff diffusion. The amount of diffusion depends on the routing coefficient K of the linear reservoir, particularly on the ratio Δt/K, where Δt is the chosen time interval, or time step. In computational hydraulics, this ratio is referred to as the Courant number.
The effect of the Courant number
can be readily ascertained by an examination of the
SSARR routing equation
|
2 C Q j+1n+1 = _________ [ Q̄ j - Q j+1n ] + Q j+1n 2 + C | (1) |
Figure 4 illustrates a sequence of hydrographs for Courant numbers varying
between
|
|
Clark's Ponce unit hydrograph methodology preserves the philosophy and intent of the original Clark method while introducing a slight modification, or improvement. Rather than routing a discrete unit-runoff hyetograph through a linear reservoir as in Clark's original method, Ponce routes a continuous unit-runoff hydrograph. This results in a slight increase in time base and a concomitant reduction in peak flow, as shown by Ponce and Nuccitelli (2013).
3. ANALYSIS
The Clark original unit hydrograph and Clark Ponce's unit hydrograph were compared by varying: (1) isochrone definition, (2) Courant number, and (3) drainage area. Ponce's online calculators ONLINE ROUTING CLARK and ONLINE ROUTING CLARK 2 were used in the analysis. In particular, the second calculator was used for the cases which required a longer time base.
Initially, a 100-km2
catchment was assumed, with five (5) isochrone definition scenarios
to simulate an array of catchment shapes (Table 1 and Fig. 5).
The purpose was twofold:
| |||||||||||||||||||||

|
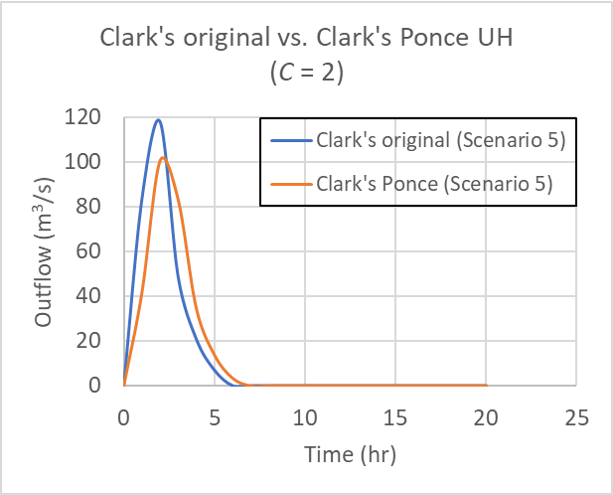
for Table 1 Scenario 1 (10, 20, 30, 40), for Courant number C = 2.
|
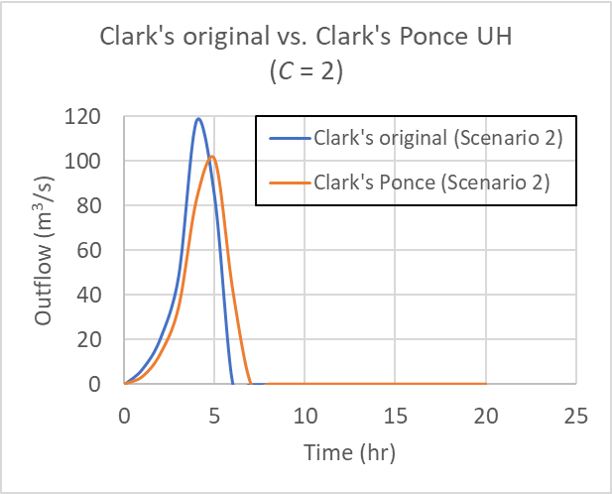
for Table 1 Scenario 2 (5, 10, 25, 60), for Courant number C = 2.
|
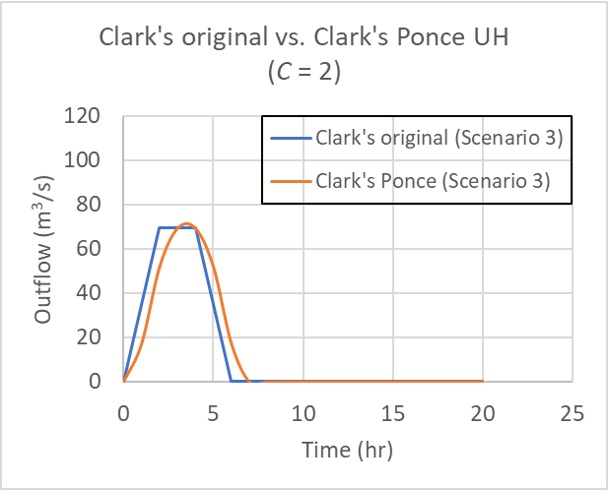
for Table 1 Scenario 3 (25, 25, 25, 25), for Courant number C = 2.
|
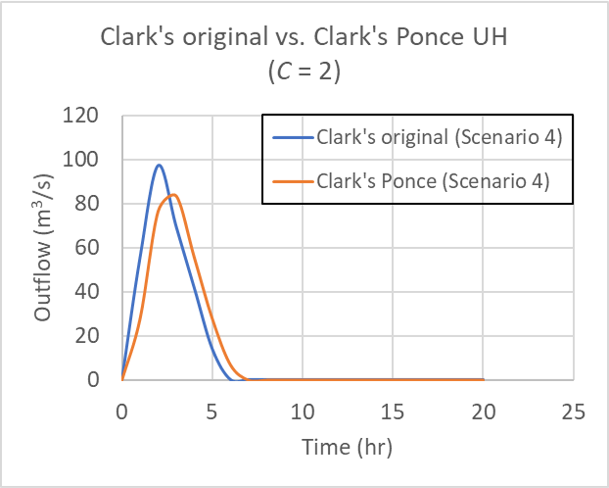
for Table 1 Scenario 4 (40, 30, 20, 10), for Courant number C = 2.

|
for for Table 1 Scenario 5 (60, 25, 10, 5), for Courant number C = 2.
Courant values ranging from 0.1 to 2 were specified
to obtain various amounts of diffusion, as shown in

|
for Table 1 Scenario 1, for Courant number C = 2.

|
for Table 1 Scenario 1, for Courant number C = 0.8.
|
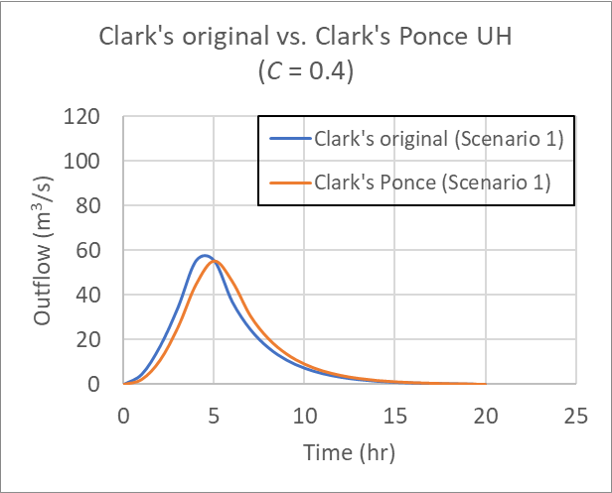
for Table 1 Scenario 1, for Courant number C = 0.4.
|
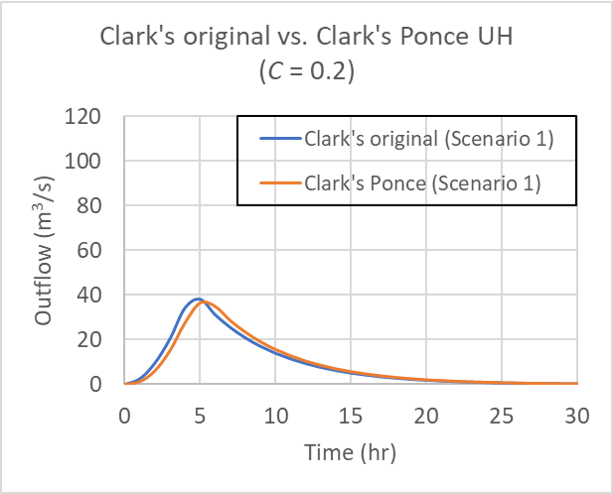
for Table 1 Scenario 1, for Courant number C = 0.2.
|
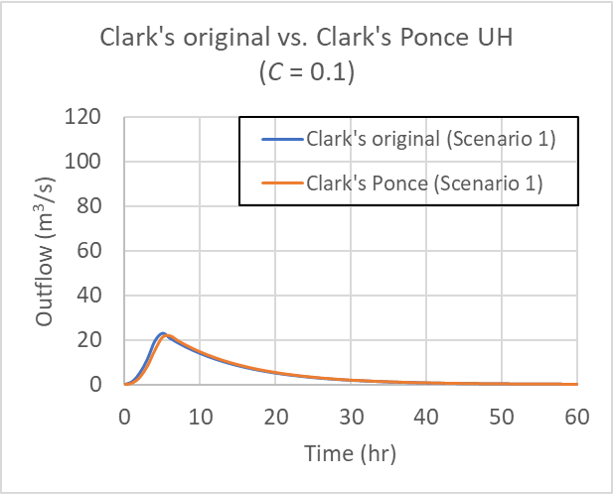
for Table 1 Scenario 1, for Courant number C = 0.1.
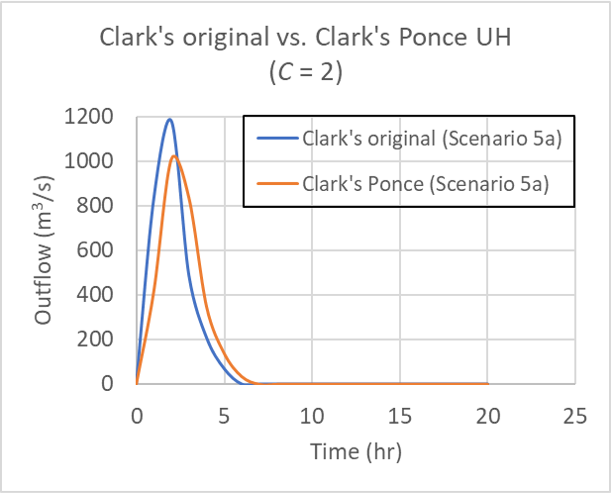
To test the effect of catchment area, a catchment area of 1,000 km2 was specified, that is, 10 times the magnitude of the previous value (100 km2), as shown in Table 2. Figure 7 shows that there is no observable differences in the hydrograph shapes.
| ||||||||||||||||||||||||


|
for Table 2 Scenario 1 (left) and Scenario 1a (right); C = 2.


|
for Table 2 Scenario 3 (left) and Scenario 3a (right); C = 2.
|
for Table 2 Scenario 5 (left) and Scenario 5a (right); C = 2.
4. SUMMARY
The theoretical basis for Clark's original (1945) and Clark's
Ponce (1989) methods of catchment routing are explained and compared.
The effect on the unit hydrograph of:
REFERENCES
Clark, C. O., 1945. Storage and the unit hydrograph. Transactions, ASCE, Vol. 110, Paper No. 2261, 1419-1446.
Ponce, V. M. 1980. Linear reservoirs and numerical diffusion. Journal of the Hydraulics Division, ASCE, 691-699.
Ponce, V. M. 1989a.
Engineering Hydrology: Principles and Practices, Section 10.2.
Englewood Cliffs, New Jersey, Prentice Hall.
Ponce, V. M. 1989b.
Engineering Hydrology: Principles and Practices, Section 10.3.
Englewood Cliffs, New Jersey, Prentice Hall.
Ponce, V. M., and
N. R. Nuccitelli. 2013. Comparison of two types of Clark unit hydrographs. Online article.
Subramanya, K. 1994.
Engineering Hydrology. McGraw-Hill, New Delhi.