|
|
|
|
HYDROLOGIC AND ENVIRONMENTAL IMPACT OF THE PARANÁ-PARAGUAY WATERWAY ON THE PANTANAL OF MATO GROSSO, BRAZIL
Online version August 2015
|
EXECUTIVE SUMMARY
|
|
|
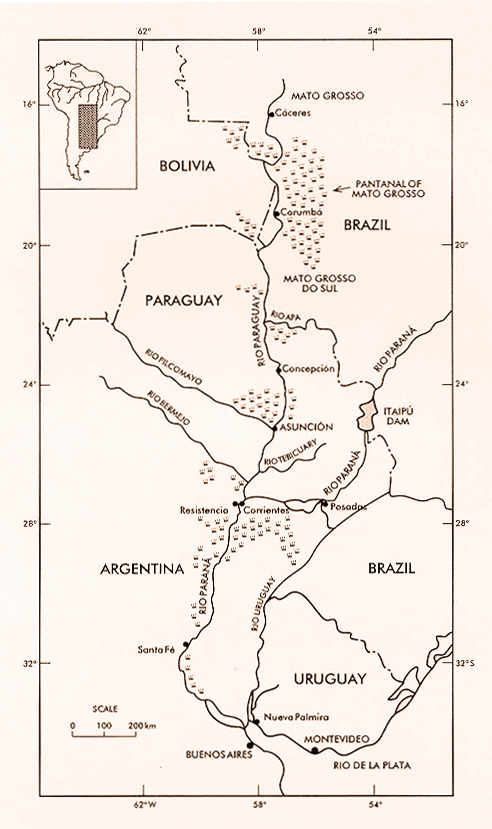
The hydrologic and environmental impacts that the proposed Hidrovia navigation project would have on the Pantanal of Mato Grosso are evaluated in this report. The Pantanal is a seasonally inundated depression, characteristically a wetland (or closely related group of wetlands), wholly contained within the Upper Paraguay river basin. It encompasses an area of 136,700 km2 in the states of Mato Grosso and Mato Grosso do Sul, in Central Western Brazil. The Hidrovia project entails navigational improvements along the existing Paraná-Paraguay Waterway, which links five countries of South America: Argentina, Bolivia, Brazil, Paraguay, and Uruguay. The project considers extensive river engineering works, including channel straightening, dredging, blasting of rocky sills, and other structural interventions to render 3,442 km of the river navigable for ocean-going vessels. The affected region would be from the downstream point at Nueva Palmira, Uruguay, to the upstream point at Cáceres, Brazil, near the headwaters of the Upper Paraguay river. At issue is the impact that extensive channel modifications will have on the Pantanal, the largest remaining wetland in the world. The proposed navigational improvements are likely to have a substantial impact on the flood regime of the Upper Paraguay river. The degree of the impact will vary depending on the type and extent of intervention and location along the river. In particular, channel straightening upstream of Corumbá will accelerate the concentration of flood runoff and increase the flood wave peak at Ladario, a key reference point in the Pantanal, during high mean (2-yr), extraordinary (4-yr), and exceptional (10-yr) floods. The Upper Paraguay river upstream of Porto São Francisco (located 146 km upstream of Corumbá) is incapable, without extensive artificial channel deepening, of accommodating ocean-going vessels (requiring a 3-m draft) throughout the year. Currently, autodredging, the river's natural self-cleaning/deepening process, provides a minimum depth of 1.2 m, except where rock outcrops do not permit autodredging to take place. The longitudinal profile of the Upper Paraguay river is convex when observed from above, revealing the presence of substantial geologic controls. These controls operate in the form of rock outcrops on the banks or rocky sills in the middle of the channel. The Pantanal exists largely because of these geologic controls, which influence the regional flow patterns in at least three places: Amolar, Porto da Manga and Fecho dos Morros. The rocky sills act as natural dams; if they are removed, extensive areas of Pantanal will no longer be subject to seasonal flooding. Blasting rocky sills as a means of deepening the navigation channel will have an irreversible impact on the hydrology of the Upper Paraguay river. Furthermore, the removal of one rocky sill may lead to the appearance of another rocky sill which was previously submerged. This is a distinct possibility in the Upper Paraguay river, where rock outcrops have been documented to occur every 40 km on the average, and where the prevailing channel slopes are so mild (around 1-2 cm/km) that the backwater effect of a 0.5-m flow obstruction can be felt for about 400 km upstream. The acceleration of runoff concentration caused by navigational improvements will intensify most annual floods, may reduce the recurrence interval of multiannual droughts, and may eventually lead to regional climatic changes in the direction of greater aridity. The Pantanal exists because its climatic/geologic/geomorphologic setting conditions it to retain water, sediment, and nutrients. Increases in flood magnitude will result in increased losses of sediment and nutrients. The annual flooding of extensive areas of Pantanal serves the dual purpose of effectively controlling overgrazing while replenishing the soil with nutrients. In addition, the seasonal flood pulse is instrumental in maintaining the extensive grasslands, since competing vegetation types, particularly the woody species, are not well adapted to extreme alternations of saturation and desiccation. Changes in hydrologic regime resulting in increased intensity of floods and droughts will impair nutrient replenishment in the Pantanal and lead to decreases in biotic productivity. These changes will produce a succession from herbaceous to woody species, which will eventually change the dominant character of the Pantanal, from savanna woodlands to more mesic forests. The open grasslands will shrink, and the cattle raising industry will be negatively impacted. |
1. INTRODUCTION
|
|
The Pantanal of Mato Grosso is a seasonally inundated depression wholly contained within the Upper Paraguay river basin. It encompasses 136,700 km2 in the states of Mato Grosso and Mato Grosso do Sul, in Central Western Brazil. The Pantanal is an immense and biologically diverse wetland, geomorphologically and hydrologically positioned to attenuate and reduce the runoff from the Upper Paraguay river basin.
The proposed Paraná-Paraguay Waterway Project, commonly known as the Hidrovia Project, entails navigational improvements along the existing Paraná-Paraguay waterway, which links five countries in South America: Argentina, Bolivia, Brazil, Paraguay, and Uruguay. Engineering and environmental impact studies are currently (1996-97) being funded by the Inter-American Development Bank (IDB) and the United Nations Development Programme (UNDP). Funding for the construction of the project may be considered at a later date.
An economic feasibility study completed by the Brazilian company Internave serves as a reference for the ongoing studies (INTERNAVE, 1990). The Internave study considers extensive river engineering works--including channel straightening, dredging, and blasting of rock outcrops--to render 3,442 km of the river navigable for ocean-going vessels from Nueva Palmira, Uruguay, to Cáceres, Mato Grosso, Brazil. Since the port of Cáceres is located upstream of the Pantanal, it is expected that the project will have an impact on the Pantanal.
The physical aspects of the proposed Hidrovia are the source of significant concern among indigenous peoples, environmental organizations, nongovernmental organizations (NGOs), professional associations, and universities and research institutions in Mato Grosso, Mato Grosso do Sul, Brazil, the American continent, and the rest of the world. At issue is the impact that extensive channel modifications, which would include channel straightening and deepening, will have on the Pantanal, the largest remaining wetland in the world (Alho et al., 1988). The uniqueness of the Pantanal ecosystems is widely recognized, and the need for their preservation on both intrinsic and economic grounds has been amply discussed in scientific, governmental, and political forums (EMBRAPA, 1986; Brazilian Constitution, 1988).
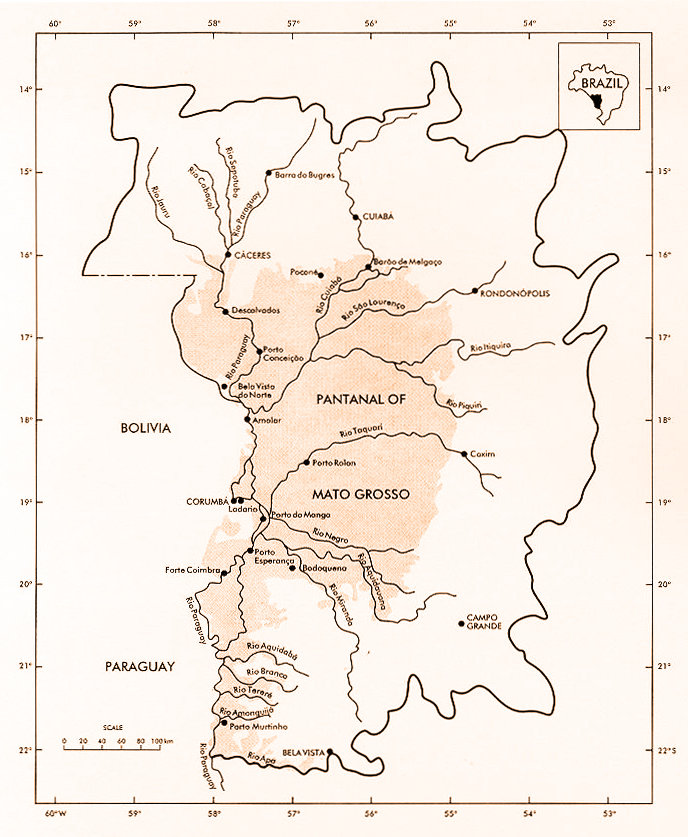
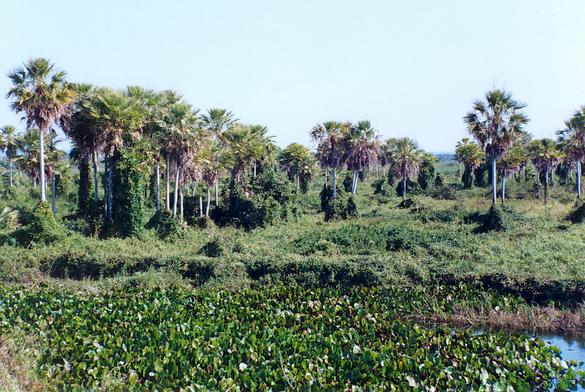
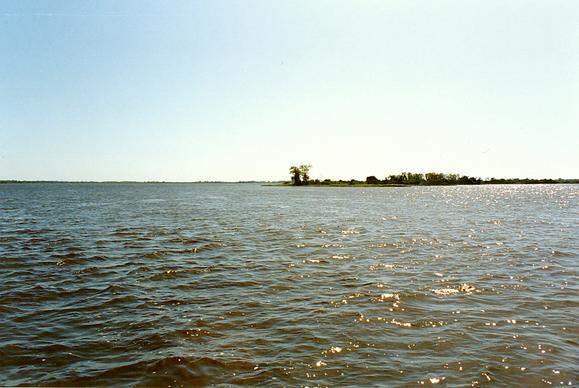
The Pantanal of Mato Grosso is characteristically a wetland (Fig. A1). Therefore, a study of the impact of the proposed project should start with the hydrologic cycle, from which all the other cycles of nature (uplift/denudation, sediment, nutrient, and biogeochemical cycles) derive. Thus, this study focuses on the hydrologic impacts of the proposed Hidrovia project on the Pantanal of Mato Grosso. Other environmental impacts, directly or indirectly related to the hydrologic impacts, are also considered.
The complexity of the Pantanal ecosystems does not permit a definitive study, particularly since their myriad of abiotic/biotic interrelations are only now being thoroughly examined. Moreover, the main features of the project (the location, nature and extent of human interventions in the river) are still in the process of being defined. Thus, this report is subtitled: A Reference Study. As such, it should serve as a reference for professionals in government, funding agencies, consulting firms, nongovernmental organizations, and universities, and others interested in reconciling human needs with the workings of nature in the context of the Pantanal.
|
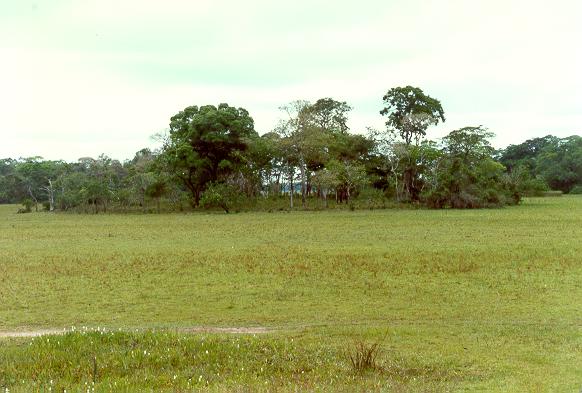
| Fig. A1 The Pantanal of Mato Grosso, Brazil. |
|
| The Pantanal of Mato Grosso, Brazil. |
2. GEOGRAPHICAL BACKGROUND
|
|
This section establishes the geographical background for this study. It is divided into four subsections:
|
|
This study focuses on the impact of the proposed Paraná-Paraguay waterway project on the Pantanal of Mato Grosso, which lies within the Paraguay river basin, a major tributary of the Paraná-Paraguay basin system.
2.1 The Paraná-Paraguay River Basin
The Paraná-Paraguay river basin is the most important of the La Plata basin system, in terms of both discharge (75%) and catchment area (84%) (Bonetto, 1975). The La Plata system is the second largest in South America, after the Amazon.
The Paraná-Paraguay basin drains an extensive region encompassing 2,605,000 km2 in Brazil, Argentina, Paraguay, and Bolivia (Fig. 1). As its name indicates, it is composed of two major rivers: the Paraná and the Paraguay. The Paraná is the largest of the two, draining 1,510,000 km2 (58%). The Paraguay river, draining the remaining 1,095,000 km2, is the most important tributary of the Paraná.
|
| Fig. 1 Geographical location of Paraná and Paraguay rivers. |
The geographical distribution of the Paraná river basin is the following: 59% in Brazil, 37.4% in Argentina, and 3.6% in Paraguay. The geographical distribution of the Paraguay river basin is: 33.4% in Brazil, 33.3% in Paraguay, 16.7% in Argentina, and 16.7% in Bolivia (Anderson et al., 1993). The combined Paraná-Paraguay river basin drains substantial portions of these four South American countries (Fig. 1). The Paraná river is divided into three sections (Bonetto, 1975):
|
2.2 The Paraguay and Upper Paraguay River Basins
The headwaters of the Paraguay river basin are located in the Serra de Tapirapuã, in the proximity of Vila de Parecis, in the state of Mato Grosso, Brazil (EDIBAP, 1979). After flowing in a general southern direction for a distance of about 2,800 km, the Paraguay river reaches the Paraná at Confluencia, north of the Argentinian cities of Corrientes and Resistencia (Fig. 1).
The Paraguay river is divided into three sections (Anderson et al., 1993):
|
|
The Pilcomayo and Bermejo rivers, tributaries of the Middle and Lower Paraguay, respectively, descend from the Andes to the West (Fig. 1). Likewise, the eastern tributaries of the Middle and Lower Paraguay flow over hilly terrain. The rest of the Paraguay river basin comprises an immense inland plain, with extremely flat relief. This peculiar geomorphologic setting has led to the existence of the Pantanal of Mato Grosso, an extensive group of wetlands located wholly within the confines of the Upper Paraguay river basin (Tricart, 1982).
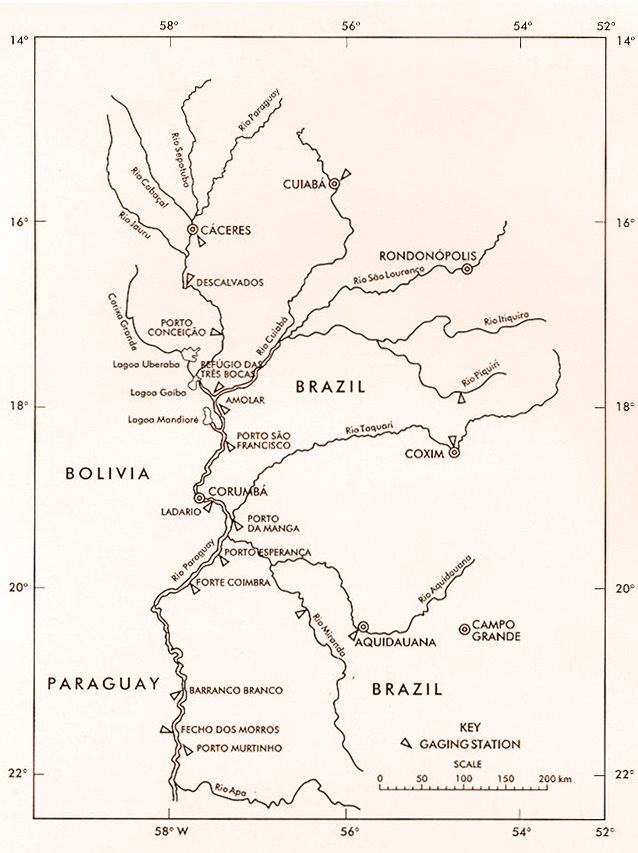
The Upper Paraguay river is the upstream section of the Paraguay river, from its
headwaters to the confluence with the Apa river (Fig. A2). The latter marks the border between
Brazil (to the north) and Paraguay (to the south). The Upper Paraguay river basin
contains the Pantanal of Mato Grosso and its headwaters, wholly within Brazilian territory,
and portions of Eastern Bolivia and Northwestern Paraguay. While the precise western
limits of the basin are uncertain (the Bañados de Izogog, in Eastern Bolivia), the
northern and eastern limits are delimited by mountain ranges, all within Brazil. To the East,
the basin is limited by the Maracaju, Caiapó, and Saudade ranges; to the North by the
Parecis range, and partly by the Azul range. The basin lies between
14° and 23°S, and
53° and
|
| Fig. A2 Confluence of the Upper Paraguay river with the Apa river, Mato Grosso do Sul. |
|
|
Fig. 2 The Upper Paraguay river basin and Pantanal of Mato Grosso |
The Upper Paraguay river basin comprises 496,000 km2, in two distinct regions (DNOS, 1974):
|
|
The principal tributaries of the Upper Paraguay river are the following (Fig. 2):
Sepotuba,
Cabaçal,
Jauru,
Cuiabá, and its tributaries São Lourenço and Piquiri-Itiquira,
Taquari, and
Miranda, and its tributary the Aquidauana.
Other tributaries, primarily intermittent, include the Negro, Aquidabã, Branco, Tereré, and Amonguijá. All these are left-bank tributaries, located wholly within Brazil.
For reference purposes, Table 1 shows selected hydrographic characteristics of the
Upper Paraguay river. Table 2 shows selected hydrologic data at gaging stations along
the Upper Paraguay river
|
| Fig. 3 Location of gaging stations along Upper Paraguay river and tributaries (DNOS, 1974). |
Table 1 shows that the Upper Paraguay river is quite sinuous, particularly upstream of Corumbá, where the sinuosity, i.e., the ratio of river length to valley length, can be quite high. For instance, the reach from 40 km downstream of Porto Conceição to Refúgio das Três Bocas, where the sinuosity is: (161 km)/(55 km) = 2.92. The influence of sinuosity on proposed navigational improvements is analyzed in Section 4.1.1.
| ||||||||||||||||||||||||||||||||||||||||||||||||||||||||||||||||||||||||||||||||||||||||||||||||||||||||||||||||||||||||||||||||||||||||||||||||||||||||||||||
Table 2 shows that the difference between maximum and minimum observed water levels along the Upper Paraguay river is smallest at Descalvados (2.61 m), remaining small (less than 3.5 m) for about 200 km downstream (at Porto Conceição it is 3.28 m; at Bela Vista do Norte it is 3.27 m). This indicates the presence of substantial channel overflows in the Upper Paraguay river between Descalvados and Bela Vista do Norte.
| |||||||||||||||||||||||||||||||||||||||||||||||||||||||||||||||||||||||||||||||||||||||||||||||||||||||||||||||||||||||||||||||
Table 3 shows that valley slopes in the Upper Paraguay river basin decrease gradually,
from
| ||||||||||||||||||||||||||||||||||||||||||||||||||||||||||||||||||||||||||||||||
2.3 The Pantanal of Mato Grosso
The Pantanal of Mato Grosso is a seasonally inundated depression wholly contained
within the Upper Paraguay river basin, encompassing approximately 136,700 km2
(Projeto RADAMBRASIL, 1982a&b). The Pantanal is geomorphologically and
hydrologically positioned to attenuate and reduce the runoff from the basin. Tricart (1982) has
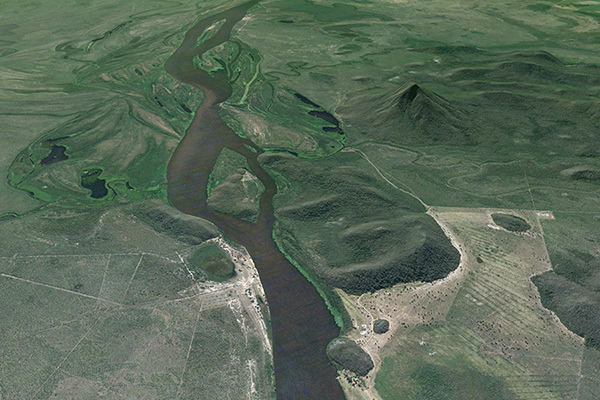
stated that the mountains to the south of the Pantanal "strangle" the valley of the Upper
Paraguay river close to the location where it exits Brazilian territory. Significantly, this
geomorphic feature is referred to locally as Fecho dos Morros, literally, "closing of the
hills."
|
| Fig. A3 Aerial view of the Upper Paraguay river at Fecho dos Morros, Mato Grosso do Sul (Google Earth®). |
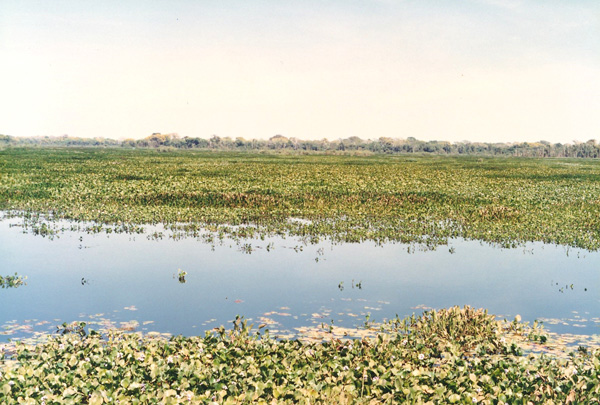
Large portions of the Pantanal are flooded only during the annual crest of the Upper Paraguay river and its tributaries, and much nonflooded terra firma is interspersed throughout the region. The mixture of permanent swamp, seasonal swamp, and nonflooded land, as well as the contiguity of the Pantanal to major South American biomes (the humid Amazon rainforest to the north and northwest, the subhumid savannas of Central Brazil to the east, the humid Atlantic forest to the southeast, and the semiarid scrub forest of neighboring Bolivia and Paraguay to the west and southwest) have conditioned the richness and variety of its vegetation and climate (Prance and Schaller, 1982). In turn, the Pantanal ecosystems support a rich and diverse fauna, including numerous species of mammals, reptiles, fish, birds, butterflies, and other invertebrates (Brown, 1986).
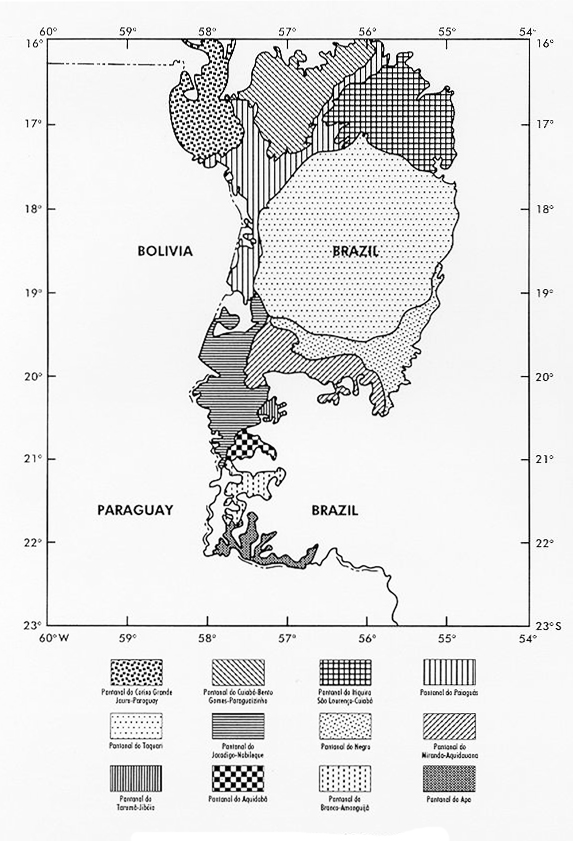
The name Pantanal of Mato Grosso tends to hide the fact that the depression of the Upper Paraguay basin consists of not one but several seasonally flooded regions, quite distinct from each other; thus, the Portuguese name Planícies e pantanais matogrossenses, which stands for "Plains and swamps of Mato Grosso" (Fig. A4).
The following pantanais were identified by Projeto RADAMBRASIL (1982a&b) (Fig. 4): Corixo Grande-Jauru-Paraguay, (2) Cuiabá-Bento Gomes-Paraguaizinho, (3) Itiquira-São Lourenço-Cuiabá, (4) Paiaguás, (5) Taquari, (6) Jacadigo-Nabileque, (7) Miranda-Aquidauana, (8) Negro, (9) Tarumã-Jibóia, (10) Aquibadã, (11) Branco-Amonguijá, and (12) Apa.
Alternatively, Adámoli (1981) has classified the Pantanal of Mato Grosso into ten pantanais: (1) Cáceres, (2) Poconé, (3) Barão de Melgaço, (4) Paiaguás, (5) Nhecolândia, (6) Aquidauana, (7) Paraguay, (8) Miranda, (9) Nabileque, and (10) Abobral.
|
|
Fig. 4 Plains and swamps of
Mato Grosso (Planícies e pantanais Matogrossenses) |
|
| Fig. A4 The Pantanal of Mato Grosso near Corumbá, Mato Grosso do Sul. |
The peculiar characteristics of the pantanais have led to the use of regional terminology to describe its most salient geomorphic features, namely baías, baixadas, barreiros, salinas, córregos, capões, cordilheiras, vazantes, and corixos. A brief description of each follows.
The baías are low-lying areas of circular, semicircular, or irregular shape, which have standing water, sometimes saline; their linear dimensions vary from tens to hundreds of meters.
The baixadas are portions of the baías subject to seasonal inundation (Silva, 1990).
The barreiros are baías that have seasonal or periodic water (Valverde, 1972).
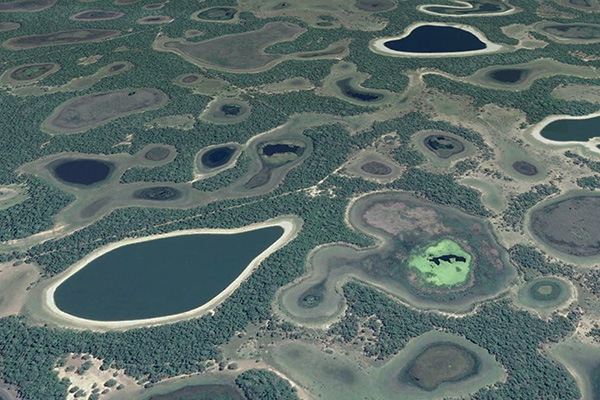
The salinas are lakes with saline water; they are covered during the dry season with salt crusts, and are for the most part unconnected from the seasonally flooded baías (Silva and Pinto-Silva, 1989) (Fig. A5).
The córregos are small watercourses (Carvalho, 1986).
The capões are vegetated earthmounds, of various sizes, and approximately circular or elliptical in shape (Ponce and Cunha, 1993).
The cordilheiras are slight terrain elevations located between the baías, with mean elevations about 2-3 m above the water level in the baías. While they are normally dry, they are subject to inundation during exceptional floods. They serve as high areas for the location of cattle ranches, and as refuge for livestock during extraordinary and exceptional floods.
The vazantes are large depressions situated between the cordilheiras, lacking a clearly defined channel (Carvalho, 1986). During the flood season, these depressions drain intermittent streams, extending for several kilometers. However, many vazantes are perennial, revealing the presence of substantial amounts of subsurface flow.
The corixos, unlike the vazantes, are small permanent watercourses connecting adjacent baías with narrower and much deeper channels. When the corixo is long and has a well defined cross section, it is referred to as corixão (Carvalho, 1986).
The characteristics of the several pantanais that constitute the Pantanal of Mato Grosso are described by Projeto RADAMBRASIL (1982a&b) and Silva (1986). The soils and inundation patterns (flooding levels) of the Pantanal are described by Projeto RADAMBRASIL (1982a&b) and Amaral Filho (1986).
|
| Fig. A5 Aerial view of salinas near the Rio Negro, Mato Grosso do Sul (Google Earth®). |
2.4 The Paraná-Paraguay Waterway (Hidrovia) Project
The Paraná-Paraguay river basin system is an extensive region in South America, which lies within the countries of Argentina, Bolivia, Brazil, and Paraguay. The neighboring Uruguay river drains portions of Argentina, Brazil, and Uruguay. The confluence of these two rivers is near the city of Nueva Palmira, Uruguay (Fig. 1). The Paraná-Paraguay and Uruguay rivers are the major tributaries of the La Plata basin system.
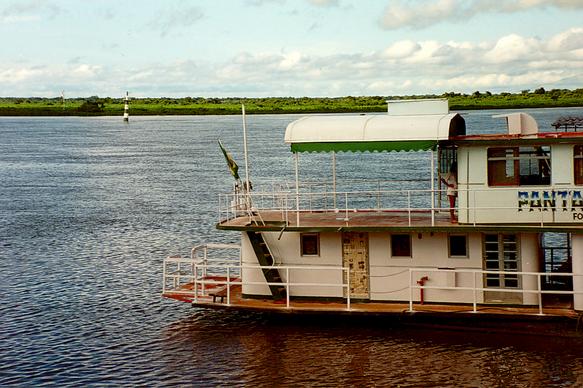
The Paraná-Paraguay basin is home to a population of almost 20 million people. For centuries, this river system has been used as a waterway for transportation. In February 1995, the IDB and the UNDP commissioned an eighteen-month series of engineering and environmental impact studies to evaluate potential navigational improvements to the exist ing waterway. This study includes the possibility of extensive engineering works to render 3,442 km of the river navigable for ocean-going vessels, from Nueva Palmira to Cáceres, Brazil. Since the port of Cáceres is located upstream of the Pantanal of Mato Grosso, the short- and long-term impacts of the proposed navigational improvements on the Pantanal should be clearly established prior to project implementation.
The project is commonly referred to as the Hidrovia project, since "Hidrovia" means waterway in both Spanish and Portuguese. The stated purposes of the Hidrovia project are to enhance current river transport via improvements to existing port, channel, and navigation facilities and to construct a year-round navigable waterway along the 3,442 km. These efforts are being planned in two stages:
|
Phase 1 (Module A): Short-term intervention This phase entails the improvement in navigational aids and the required river engineering, including dredging and related works, along 80% of the proposed project's length. The affected region extends from the downstream port of Nueva Palmira, upstream to the port of Corumbá/Ladario, in Brazil, and neighboring Puerto Quijarro, in Bolivia. Phase 2 (Module B): Medium- and long-term intervention
This phase entails the improvement in navigational aids and the required river
engineering, including dredging, channel modification, and other major river interventions,
along the entire length of the proposed project (3,442 km), from Nueva Palmira to
Cáceres. |
The executive agency for the Hidrovia project is the Comité Intergubernamental de la Hidrovia (CIH) (Intergovernmental Committee of the Waterway), established in 1989 by the Ministers of Public Works and Transport of Argentina, Bolivia, Brazil, Paraguay, and Uruguay. The headquarters of the CIH is in Buenos Aires, Argentina.
To date (1995), the only comprehensive document with enough detail on the Hidrovia project is the Internave report, commissioned by the extinct Empresa de Portos do Brasil (PORTOBRAS), and completed in 1990 by the Brazilian company of the same name (INTERNAVE, 1990). This report is basically an economic feasibility study of the Hidrovia project. As such, it uses projections of economic benefits to justify the costs involved in project implementation.
The Internave report has been criticized for its overly optimistic projections of benefits
(CEBRAC/ICV/WWF, 1994). The IDB has formally rejected the Internave study and
will use the
Channel straightening by realignment and cutoffs, dredging, and blasting of rocky sills
are being considered to improve navigational conditions along the waterway.
In particular, the Terms of Reference of the Phase 2 (Module B-1) engineering study, under
Section 1-Purpose, states the following task (No. 4), among seven others (IDB, 1995,
p. 2):
"The development of a preliminary project of alternatives to improve
the conditions of the waterway, including dredging, blasting of rocky
sills, channel straightening, stabilization of the navigation channel,
regularization of the water resources, and any navigational structure
that is considered pertinent."
The extent of these interventions and their possible impact on the hydrologic regime of the Pantanal of Mato Grosso will be better known by the second half of 1996, once the ongoing studies are completed. The IDB has asserted that it may not fund the Hidrovia project through the Pantanal if serious environmental impacts are anticipated (Lammers et al., 1994). Thus, the present study is a contribution to the proper assessment and evaluation of these impacts.
The Internave report lists the various geographic locations along the Hidrovia project, starting from the port of Buenos Aires (km 0), progressing upstream to the port of Cáceres (km 3,442). For reference purposes, an abstracted list of locations relevant to this study is shown in Table 4. Minor discrepancies between river distances in Tables 1 and 4 reflect the different sources for these tables: DNOS (1974) and INTERNAVE (1990).
| |||||||||||||||||||||||||||||||||||||||||||||||||||||||||||||||||||||||||||||||||||||||||||||||||||||||||||||||||||||||||||||||||||||||||||||||||||||||||||||||||||
|
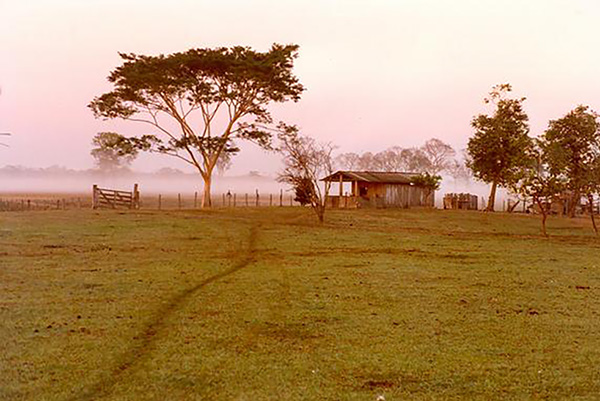
| Fig. A6 Dawn at the Pantanal of Mato Grosso near Rio Cassanges, Mato Grosso. |
3. THE UPPER PARAGUAY RIVER AND PANTANAL OF MATO GROSSO
|
|
This section describes the physiographic and hydrologic characteristics of the Upper Paraguay River and the adjoining Pantanal of Mato Grosso. It is divided into four subsections:
|
The information of this section serves as the basis for the analysis of Section 4.
3.1 Geological Setting
The geology of the Upper Paraguay river and environs is described in Almeida (1945), Projeto Bodoquena (1979), Projecto RADAMBRASIL (1982a&b), and Godoi Filho (1986), among others. The predominantly Upper Precambrian formations underlie extensive Quaternary deposits, but with significant rock outcrops. Geomorphologic evidence reveals the presence of substantial tectonic activity in the form of subsidence and uplift (Freitas, 1951; DNOS, 1974; Orellana, 1979; Ab'Sáber, 1988).
Table 5 shows the stratigraphic units that are present in the Upper Paraguay river. The Upper Precambrian is represented by the groups Alto Paraguay, Corumbá, and Jacadigo, and their respective formations; the Paleozoic by the Coimbra formation; the Mesozoic by the Alkaline Fecho dos Morros formation; and the Cenozoic by the Xaraiés and Pantanal formations. Table 6 lists primary rock types, including sandstones, silt stones, limestones, conglomerates, dolomites, calcareous dolomites, syenites, trachytes, calcareous tufa, and travertines. Table 7 shows the general location of rock outcrops in the vicinity of the Upper Paraguay river.
| |||||||||||||||||||||||||||||||||||||||||||||||||||||
| ||||||||||||||||||||||||||||||||||
| |||||||||||||||||||||||||||||||||||||||||||||||||||
Navigation charts confirm the existence of numerous rock outcrops on or along the Upper Paraguay river (Marinha do Brasil, 1974; and later dates). A list of these outcrops is shown in Table 8, and their possible rock types in Table 9. Significantly, four of these outcrops are located in the middle of the channel, such as Passo Simão Nunes Inferior, Córrego Bonfim, Farolete Balduíno (Fig. A7), and Passo Mucunã, effectively functioning as grade controls. The existence of rock outcrops have been recognized for more than a century (Leverger, 1862a&b). Some of them have been documented in the Internave report (INTERNAVE, 1990).
| ||||||||||||||||||||||||||||||||||||||||||||||||||||||||||||||||||||||||||||||||||||||||||||||||||||||||||||||||||||||||||||||||||||||||||||||||||||||||||||||||||||||||||||||||||
| |||||||||||||||||||||||||||||||||||||||||||||||||||||||||||||||||||||||||||||||||||||||||||||||||||||||||||||||||||||||||||||||||||||||||||||||||||||||||||||||||||||||||||||||
|
| Fig. A7 Farolete Balduíno, near Corumbá, Mato Grosso do Sul. |
These facts confirm that the Upper Paraguay river is substantially controlled by the prevailing geology. While the Quaternary sediments of the Pantanal formation are the most obvious surficial feature of the landscape, the longitudinal slope of the river is controlled more by the rock outcrops than by the alluvium. As shown in Table 8, there are thirty-two (32) rock outcrops within 1,270 km of river, an average of one every 40 km.
Other outcrops along the river, particularly that of canga, may have been less
thoroughly documented. According to Dorr (1945), canga is colluvium or talus, composed in
large part of fragments of iron-rich rock, which has been recemented into a coherent
mass by limonite. In the vicinity of the Morro de Urucum, these outcrops tend to have a
linear distribution, suggesting the possibility of a fault (Dorr, 1945; Almeida, 1945).
Moreover, it is noted that the Internave report mentions the occurrence of canga in
several places along the river, including Porto Rabicho
Table 10 describes three geologic faults in the vicinity of the Upper Paraguay river (Projeto RADAMBRASIL, 1982a). The Falha da Lagoa, which crosses Lagoa Gaíba (Section 3.3.1), may have a significant effect on the flow of the Upper Paraguay river. Likewise, the Falha da Penha, which also crosses Lagoa Gaíba, is strategically located in close proximity to the river (Fig. 5). According to DNOS (1974), it appears that the northern portion of the Pantanal has subsided in relation to the Serra do Amolar (Section 3.2). This would explain the elevated position of the older rocks in the Serra do Amolar.
| ||||||||||||||||||||||||||||
|
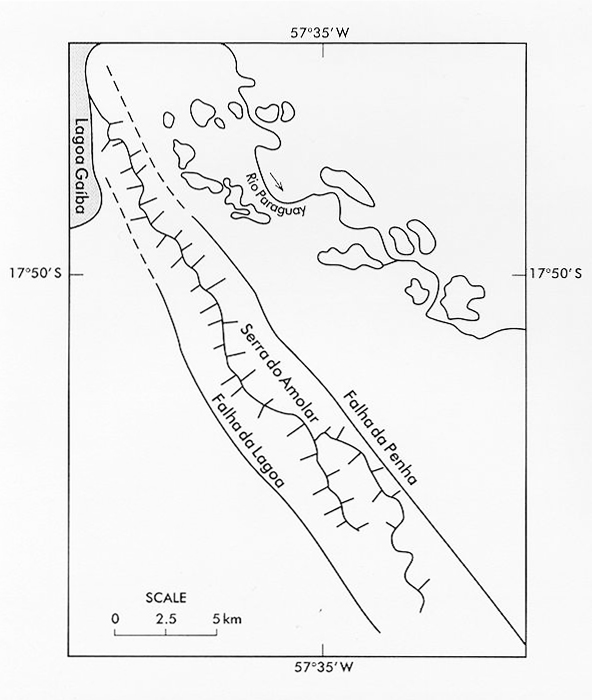
Fig. 5 Geographic location of Falha da Lagoa and Falha da Penha |
The tectonic character of the Upper Paraguay river basin has been admirably described by Freitas (1951). Orellana (1979) has stated that active faults in a direction contrary to the regional runoff have created local sills (soleiras) that act to impede runoff. More recently, Ab'Sáber (1988) has attributed the genesis of the Pantanal to "a tectonic character dominated by a system of faults which are geomorphologically contrary..."
A historical note regarding rock outcrops in the Upper Paraguay: In
describing his passage through Lagoa Gaíba almost 150 years ago (1846), Captain Augusto
Leverger of the Brazilian Navy cautioned against the rocky sills which protrude onto the
lake as follows (Leverger, 1862a, p. 317):
"...Virando a Norte, tive de circumdar um como promontorio da margem
do poente da lagoa o qual é terminado por um cabeço pedregoso e coberto
de mato, ao cual devese dar resguardo a fim de evitar as muitas pedras
que o cercam, umas submergidas, outras a flor de agua ou pouco
elevadas..."
3.2 Geomorphological Setting
The geomorphology of the Upper Paraguay river basin is described in Projecto RADAMBRASIL (1982a&b) and Silva (1986). The geomorphic units in the vicinity of the Upper Paraguay river are:
|
The Serras of Urucum-Amolar comprise two groups of serras (residual hills or mountain ranges) located to the right (west) of the Upper Paraguay river, close to the Bolivian border. These serras are important because of their strategic location, on the right bank, and often next to the river. The Serra do Urucum, southeast of Corumbá, comprises the morrarias (group of residual hills) of Urucum, Santa Cruz, São Domingos, Grande, Rabichão, and Tromba dos Macacos; further south, about 40-50 km, are the morrarias of Zanetti, Albuquerque, Mato Grande, Saiutã, and Pelada.
The Serra do Amolar, about 60-160 km north of Corumbá, comprises the Serra do Amolar proper and the morrarias of Ínsua, Novos Dourados, Santa Tereza, Castelo, and others of smaller size. The elevation of these mountains varies from 300 to 900 m, the highest point being at Morro Grande (1,065 m). The contact between the Serra of Urucum-Amolar and adjacent geomorphic units is often sudden, revealing the presence of faults of probable Cenozoic age (Projeto RADAMBRASIL, 1982a).
The Serrana Province consists of a group of serras of roughly parallel crest alignment, located east of Cáceres, trending in a predominantly SW-NE direction. From SW to NE, these serras are: (1) Simão Nunes, (2) Colonia, (3) Acorizal, (4) Facão, (5) Primavera, (6) Ponta do Morro, (7) Quilombo, (8) Morro Grande, (9) Jacobina, (10) Barreiro Preto, (11) Chapola, (12) Boi Morto, (13) Bocainão, (14) Campina, and (15) Retiro (Projeto RADAMBRASIL, 1982a). The Serra Simão Nunes, the most southwestern of the group, comes in direct contact with the Upper Paraguay river in several locations along 45 km of river, on the left bank, from Passo Acuri, at km 2,128 (km 3,368 of the Hidrovia), to Passo Morro Pelado, at km 2,083 (km 3,323 of the Hidrovia) (Table 20). The elevations in the Serrana Province vary from 300 to 700 m. The rock formations are those of the Alto Paraguay group (Table 5).
The Depression of the Paraguay River comprises extensive plain surfaces which surround the Serrana province, and to a lesser extent, the Serra of Urucum-Amolar. The relief is mild, slightly undular, with elevations varying between 150 to 250 m, and has underlying Precambrian and Cambrian formations, which often outcrop through the Quaternary deposits.
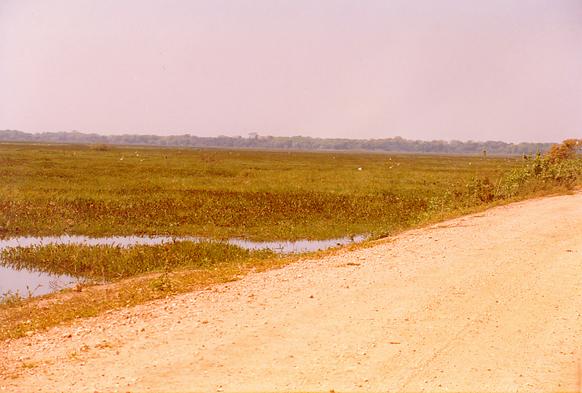
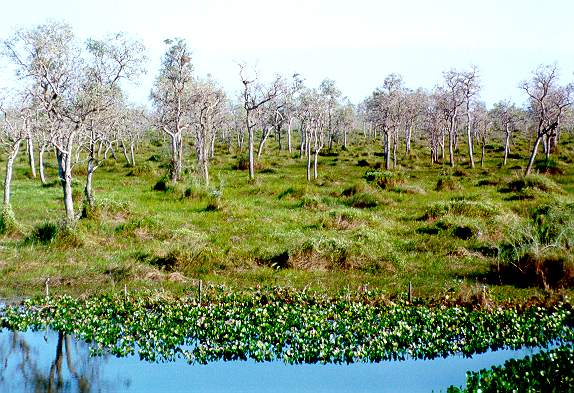
The Plains and Swamps of Mato Grosso (Planícies e Pantanais Matogrossenses) resemble an amphitheater of roughly semicircular shape, with its approximate center at Corumbá, comprising 28% of the Upper Paraguay river basin (Fig. 2). The plains are a series of mutually coalescing alluvial fans, surrounded by the Depression of the Paraguay River almost continuously to the east, and discontinuously to the north and south. They comprise an extensive surface of accumulation, of extremely flat relief, with elevations varying from 80 to 150 m, and subject to seasonal flooding by the Upper Paraguay river and its tributaries (Fig. A8).
|
| Fig. A8 Campo Jofre, in the Pantanal of Mato Grosso. |
Valley slopes are about an order of magnitude greater along the tributaries than along the main channel. The tributaries cross the plains in a predominantly east-west direction, with a slight orientation towards the center of the amphiteather, with valley slopes of 12 to 50 cm/km. The high sediment production of the tributaries has forced the main channel of the Upper Paraguay, which runs predominantly from north to south, to closely parallel the western edge of the plains (Schumm, 1977). Moreover, its unusually mild slope (0.7-6.5 cm/km) causes it to regularly overflow its banks during the wet season.
Sánchez (1978) has identified ten geomorphic subunits within the plains and swamps of Mato Grosso (Table 11). The Pantanal is seen to be a complex mosaic of geomorphic features or subunits, with a regional base level at the Upper Paraguay river, along the western edge of the plains. In turn, the base level of the Upper Paraguay river is at its mouth, at the confluence with the Apa river.
| ||||||||||||||||||||||||||||||||||
The sequence of events leading to the formation of the Pantanal has been described by Projeto Bodoquena (1979) and Ab'Sáber (1988). During the Jurassic period, the prevailing arid climate led to substantial sediment deposition, mostly in the form of sand dunes. The Cretaceous period that followed saw a change to a more humid climate, which transformed the desert into a flood plain with numerous lakes and swamps. The end of the Mesozoic era signaled the end of sedimentation and the beginning of slow epeirogenic movements, which were generally upwards.
The subsidence of the Pantanal occurred later, probably in the Pleistocene (Tricart, 1982). A clear evidence of subsidence is the great depth of the Quaternary deposits, which at Fazenda Piquiri reaches beyond 320 m, and at Fazenda São Bento, beyond 420 m (320 m below sea level). The maximum depth of the Pantanal sediments has been estimated at 500 m at the Pantanal's center, on the alluvial fan of the Taquari river (Godoi Filho, 1986). Tectonic uplift to the south strangled the exit of the depression. In the last 6 million years, under the effects of subsidence and uplift, the Upper Paraguay river has been forced to carve an exit through the basal rocks to the south, a situation which explains its unusually mild slopes.
3.3 Hydrological Setting
The hydrology of the Upper Paraguay river is described in DNOS (1974) and EDIBAP (1979). The Upper Paraguay river flows from its headwaters in the Serra de Tapirapuã, in Mato Grosso, to its mouth at the confluence with the Apa river, in Mato Grosso do Sul. At Cáceres, where it meets the first human settlement of importance, the river drains an area of 33,860 km2; at the Apa river confluence, downstream of Porto Murtinho, it drains an area of 496,000 km2 (Fig. A9).
|
| Fig. A9 The Upper Paraguay river at Cáceres, Mato Grosso. |
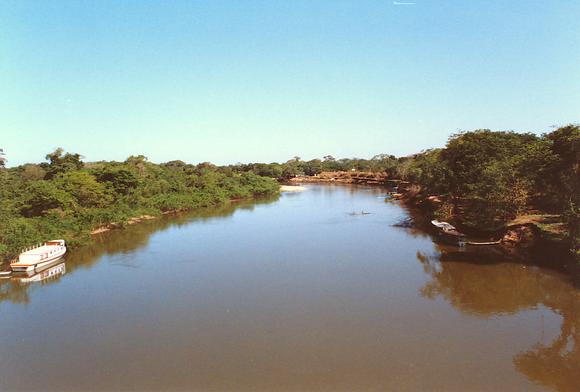
The distance along the river, from Cáceres to the Apa river confluence is 1,270 km. Throughout most of this distance, the Upper Paraguay river crosses the Pantanal of Mato Grosso, flooding the Pantanal typically from March to August, and draining it from September to February. Thus, the hydrology of the Upper Paraguay river is effectively connected to and interdependent with that of the Pantanal. This blurs the distinction between surface water and groundwater, significantly increasing the complexity of hydrologic analysis. In fact, the peculiar geologic and geomorphologic setting of the Upper Paraguay river and the adjoining Pantanal results in a unique hydrologic behavior, unmatched in the American continent.
The prevailing climate is dry subhumid, grading to wet subhumid along a narrow strip paralleling the mountain ranges that delimit the basin to the north, east, and south, and humid in limited northernmost areas bordering with the Amazon basin (EDIBAP, 1979). The spatially averaged, mean annual rainfall in the Upper Paraguay basin ranges from 1,180 mm (Projeto RADAMBRASIL, 1984) to 1,380 mm (EDIBAP, 1979), depending on the data source. This fact alone would dictate that the mean runoff coefficient (the ratio of mean annual runoff to mean annual rainfall) should be relatively high, perhaps somewhat less than the global average, estimated at 0.39 for peripheral continental areas by L'vovich (1979) or 0.46 by Berner and Berner (1987). Instead, the mean runoff coefficient of the Upper Paraguay is quite low, varying in the range 0.07-0.10, depending on which data is used in the calculation (Section 3.3.4).
The abnormally low runoff coefficient of the Upper Paraguay river is a direct result of its hydrologic interaction with the Pantanal. The latter functions as an immense surface/subsurface reservoir which stores water annually and multiannually. In the annual time frame, the Pantanal stores water during the wet season and releases it back to the main channel during the subsequent dry season. In the multiannual timeframe, the Pantanal stores water in a wet year and releases it back to the main channel in a dry year. In this process, the slowness of which is compounded by the unusually mild relief, large amounts of would-be runoff are instead returned to the atmosphere through evaporation and evapotranspiration. The latter helps to sustain a series of closely related ecosystems, characteristically marshes or wetlands, their biotic productivity closely linked to the annual flood pulse (Junk et al., 1989).
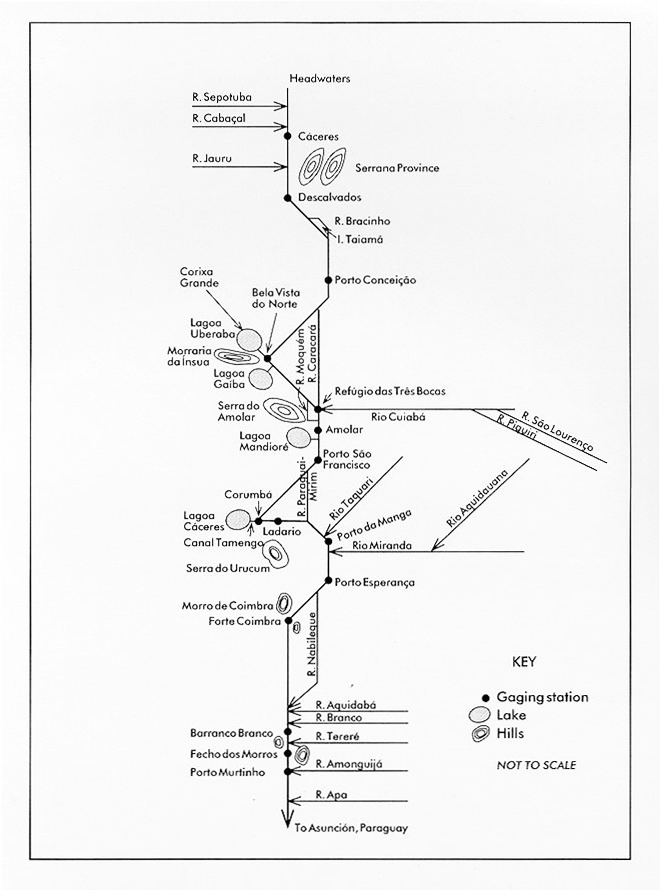
3.3.1 Hydrography
The hydrography of the Upper Paraguay river, from Cáceres to the Apa river confluence, is shown in schematic form in Fig. 6. At Cáceres, the Paraguay river has already received the contributions of two of its most important right-bank tributaries: Sepotuba and Cabaçal. From Cáceres, the river flows south towards Descalvados, a distance of 139 km along the river. At a point 71 km downstream of Cáceres, the Paraguay receives the contribution of its third important right-bank tributary, the Jauru.
|
| Fig. 6 Schematic of the hydrography of the Upper Paraguay river. |
From Descalvados, the river flows first southeast and then turns south towards Porto Conceição, a distance of 121 km. At a point 46 km downstream of Descalvados, the river branches into two channels: the Paraguay proper (to the right) and the Bracinho (to the left). This bifurcation marks the beginning of the Pantanal proper; from this point on, as far downstream as Amolar, the Paraguay river crosses extensive areas of lakes (baías or lagoas) and adjoining permanently flooded plains. The two branches delimit the island of Taiamã, and rejoin 43 km downstream, measured along the main channel.
From Porto Conceição, the river first flows south and then turns southwest towards (Fazenda) Bela Vista do Norte, a distance of 135 km. At a point 40 km downstream of Porto Conceição, the river again branches into two channels: the Paraguay proper (to the right) and the Caracará (to the left). The two branches form the great island of Caracará and rejoin further south, near Refúgio das Três Bocas. The main channel of the Paraguay flows southwest towards Bela Vista do Norte, at the base of Morraria da Ínsua (Fig. 7). The Caracará branch flows south towards Refúgio das Três Bocas, in the vicinity of the Serra do Amolar.
|
| Fig. 7 Detail of Lagoa Gaíba. |
The island of Caracará constitutes a veritable inland delta, with its apex at the bifurcation (40 km downstream of Porto Conceição), and its base the Paraguay river itself, which turns from Bela Vista do Norte southeast to Refúgio das Três Bocas, flowing for a distance of 53 km. During extraordinary and exceptional floods, most of the island of Caracará is completely submerged.
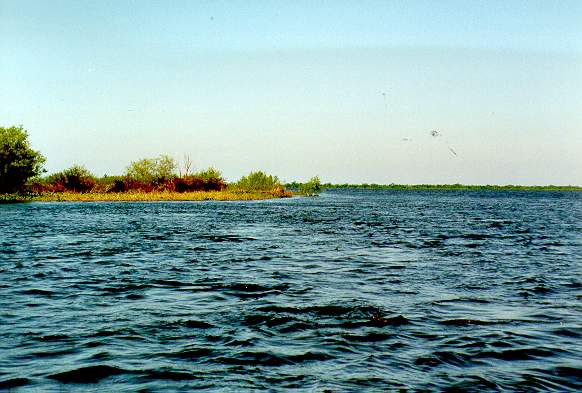
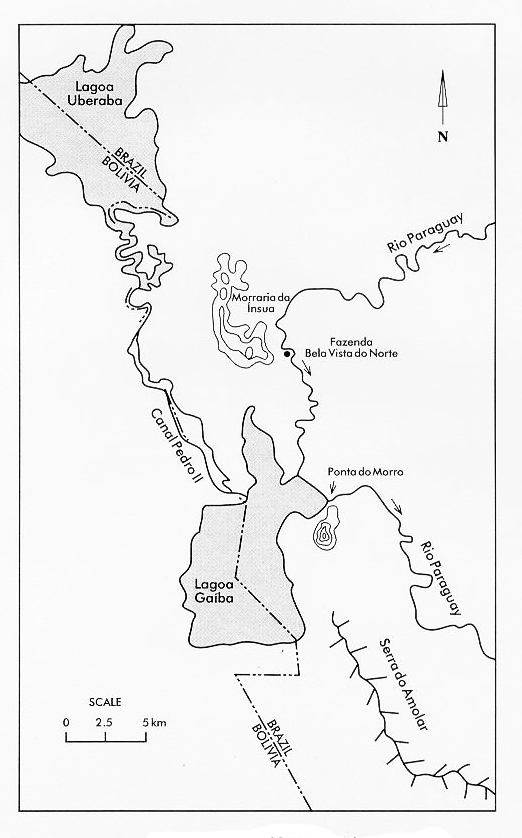
In the vicinity of the Morraria da Ínsua and the Serra do Amolar, the Paraguay river interacts with three large lakes: Uberaba, Gaíba, and Mandioré (Figs. 3 and 6). The larger of the three, Lagoa Uberaba, located north of Morraria da Ínsua, receives over flows from the Paraguay as well as runoff from local streams and from Corixa Grande, the last significant right-bank tributary of the Paraguay.
Lagoa Gaíba is located between Morraria da Ínsua and Serra do Amolar. It consists of three smaller lakes:
|
The link between the Upper Paraguay river and Lagoa Gaíba is the Riacho da Gaíba. However, a branch of the Paraguay drains into Pre-Gaíba. The Riacho da Gaíba is generally as deep as the Paraguay, excluding the exit of Lagoa Gaíba, where it is extremely shallow, with a depth of 0.1-0.6 m and a width of 2,000 m (DNOS, 1974). Judging by the unmixed colors of its waters, the Riacho da Gaíba appears to drain Lagoa Gaíba to the right (reddish color, iron-rich dissolved solids), Lagoa Uberaba to the center (dark color, humic colloids), and the main channel of the Paraguay river to the left (light brown color, suspended sediments) (Fig. 7). The link between Lagoa Gaíba and Lagoa Uberaba is the Canal Pedro II, with a length of about 100 km. The direction of the current in the Canal Pedro II is normally from Lagoa Uberaba to Gaíba, but it can change seasonally if the flow is considerably reduced (DNOS, 1974).
From Refúgio das Três Bocas, the river flows south towards Amolar, a distance of 28 km. Shortly before reaching Refúgio das Três Bocas, the river branches into two channels: the Paraguay to the left, and the Moquém to the right. Before rejoining the Paraguay, the Moquém river branches into the Ingazal, which joins together with the São Jorge, another branch of the Paraguay. In turn, the São Jorge rejoins the Paraguay immediately upstream of Amolar. These bifurcations reveal the extremely small gradient in this section of the Paraguay river.
From Amolar, the river flows south towards Porto São Francisco, a distance of 58
km. At a point
From Porto São Francisco, the river flows in a general southwestern direction towards
Corumbá, a distance of 146 km, and then turns east to Ladario, a distance of 7 km from
Corumbá (Fig. A10). At a point
|
| Fig. A10 Upper Paraguay river near Corumbá, Mato Grosso do Sul. |
From Ladario, the river flows first east and then southeast to Porto da Manga, a distance of 69 km. At a point 32 km downstream of Ladario, the Paraguay river receives the contribution of the Taquari Velho (an ancient channel of the Taquari river) to the left. About 2 km upstream of Porto da Manga, the Paraguay river receives the contribution of the Taquari river to the left. The Negro river, a tributary of the Taquari, flows into the latter right upstream of its confluence with the Paraguay.
From Porto da Manga, the river flows southwest to Porto Esperança, a distance of 58 km. At a point 24 km downstream of Porto da Manga, the Paraguay river receives the contribution of the Miranda river (Fig. A11). Together with the Aquidauana river, its principal tributary, the Miranda river drains extensive areas of Pantanal and Upper Paraguay river basin to the southeast.
|
| Fig. A11 The Miranda river, Mato Grosso do Sul. |
From Porto Esperança, the river continues to flow southwest to Forte Coimbra, a distance of 67 km (Fig. A12). Between 2 and 40 km downstream of Porto Esperança, the Paraguay river overflows to the left during floods to feed its branch, the Nabileque. The latter crosses the plains east of the Paraguay river in a general southern direction for about 250 km, eventually rejoining the Paraguay river at a point located 217 km downstream of Forte Coimbra.
|
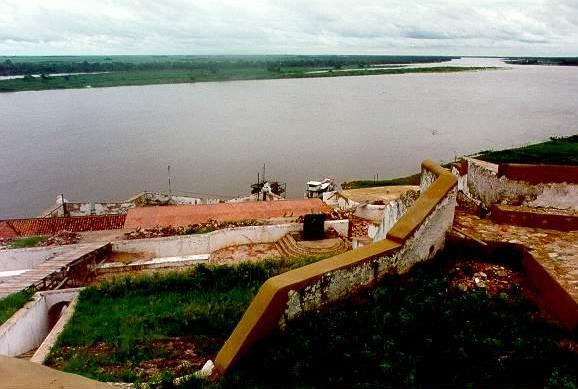
| Fig. A12 Upper Paraguay river at Forte Coimbra, Mato Grosso do Sul. |
From Forte Coimbra, the river flows in a general southern direction for 239 km
towards Barranco Branco; then an additional 51 km to Fecho dos Morros, and from there,
36 km to Porto Murtinho
|
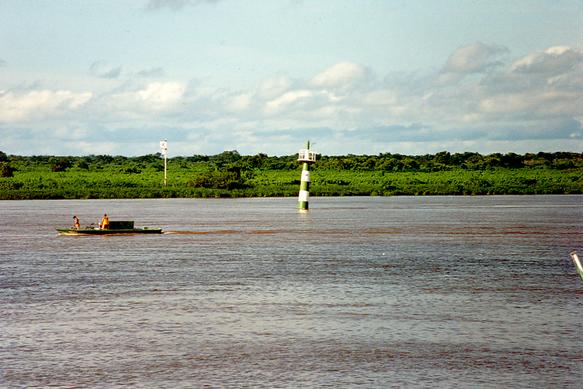
| Fig. A13 Upper Paraguay river near Porto Murtinho, Mato Grosso do Sul. |
From Porto Murtinho, the Upper Paraguay river flows south for another 63 km to reach its mouth at the confluence with the Apa river.
Table 12 shows selected hydrologic data at gaging stations along the Upper Paraguay river: drainage area, channel length, channel slope, and mean annual discharge. The following observations are made:
The subbasin drainage areas are not precisely defined in several points, particularly between Descalvados and Amolar. This is due to the extreme complexity of the drainage patterns, including channel bifurcations and endorheic drainages.
There is a slight reduction in channel slope and mean annual discharge from Descalvados to Porto Conceição, as the Paraguay river enters the Pantanal proper. This is where the Paraguay river begins to flood the Pantanal extensively.
There is a marked reduction in channel slope and mean annual discharge from Porto Conceição to Bela Vista do Norte, as the Paraguay river flows through and around the island of Caracará.
At Refúgio das Três Bocas-Amolar, the channel slope is further reduced to a mere 1.82 cm/km, while the mean annual discharge at Amolar increases sharply (to 943 m3/s). This indicates the substantial contributions of surface and subsurface runoff immediately upstream of this point.
Downstream of Amolar, the channel slope increases somewhat to Porto Esperança, while the mean annual discharge continues to increase gradually all the way to Porto Murtinho, near the basin's mouth.
Downstream of Porto Esperança, the channel slope decreases again, reaching a value of only 0.83 cm/km in the reach between Fecho dos Morros and Porto Murtinho.
The mean annual discharge of the Upper Paraguay river at its mouth is estimated to be
1,565 m3/s, based on measurements at Fecho dos Morros and Porto Murtinho.
| ||||||||||||||||||||||||||||||||||||||||||||||||||||||||||||||||||||||||||||||||||||||||||||||||||||||||||||
The average channel slope along the Upper Paraguay river, from Cáceres to Porto
Murtinho, is
According to principles of fluvial geomorphology, a river that is free to move its bed eventually carves a concave upwards bed profile (Leopold et al., 1964; Leopold, 1994; Christofolleti, 1980). Thus, the documented convexities in bed elevation of the Upper Paraguay river reveal the presence of substantial geologic controls. These controls are operating in at least three reaches:
|
|
The extent of the geologic control can be assessed by calculating the size of the hump at locations where its presence is suspected. For instance, from Table 12, the average channel slope from Refúgio das Três Bocas to Porto São Francisco can be calculated to be 3.51 cm/km. Therefore, a measure of the hump at Amolar is:
|
|
Likewise, the average channel slope from Ladario to Porto Esperança is 2.70 cm/km. Therefore, a measure of the hump at Porto da Manga is:
|
|
The extent to which these humps can cause backwater in these channels of extremely mild slope is evaluated in Section 4.1.1.
A similar calculation at Porto Murtinho is not possible because of lack of data at the river's mouth. However, the downstream river (i.e., the Middle Paraguay) has an average slope of 6 m/km throughout its 797-km length (Anderson et al., 1993). This much larger downstream slope points to the presence of a substantial geologic control upstream, at Fecho dos Morros, near the mouth of the Upper Paraguay river (Fig. 3). Significantly, this is precisely the location of the syenite sill mentioned by DNOS (1974).
|
| Fig. A14 Eastern margin of the Upper Paraguay river near Porto Murtinho, Mato Grosso do Sul. |
3.3.2 Flood Hydrology
The flood regime of the Upper Paraguay river is a result of complex climatic interactions at the various atmospheric spatial scales. The climate is determined primarily by the basin's geographic location (latitude and continental location) and secondarily by its topographic relief and surface features. Mean annual rainfall varies from as high as 1,800 mm at Chapada dos Parecis, the northernmost part of the basin, to as low as 800 mm in the alluvial fan of the Taquari river, near the basin's center (Projeto RADAMBRASIL, 1984). Within these limits, mean annual rainfall increases toward the mountains and high plains (planaltos) in the basin perimeter, and decreases toward the alluvial plains at the basin center.
Rainfall is concentrated in the summer months. The wettest three-month period is December-February; the driest is June-August. The temporal distribution of rainfall has a tendency to vary spatially in a general north-south direction. The percentage of annual rainfall in the wettest three-month period is greatest in the north (48% at Cáceres), gradually decreasing toward the south (to 36% at Porto Murtinho). Thus, the northern portion of the basin is prone to flooding from tributary streams. On the other hand, the percentage of annual rainfall in the driest three-month period is smaller in the north (3% at Cáceres), gradually increasing toward the south (8% at Corumbá, and 12% at Porto Murtinho) (EDIBAP, 1979). This indicates the possibility of local droughts recurring on an annual basis.
In any stream, the number of flood peaks per year is a good indication of the extent to which surface runoff is being diffused (i.e., attenuated) by the prevailing geomorphic conditions. If the number of flood peaks per year is high, say more than 10, there is little runoff diffusion. Conversely, if there is only one flood peak, runoff diffusion is at its maximum. The Upper Paraguay tributaries have a number of flood peaks, following intense storms that cover all or portions of their respective drainage basins. For instance, the Cuiabá river at Cuiabá has 15 flood peaks per year on the average; the Taquari river at Coxim has 18 flood peaks; the Miranda river at Miranda has 12 flood peaks (DNOS, 1974). A sequence of several flood peaks depicts the local nature of the floods as well as the absence of significant attenuation (the channel gradient varies from 7 to 50 cm/km, Table 3).
Unlike its tributaries, the Upper Paraguay river behaves quite differently with respect to the number of flood peaks. This reflects both its milder gradient (0.7 to 6.5 cm/km) and the presence of the Pantanal, which stores and further attenuates the flood peak. The overall effect of this hydrologic process is a reduction in the number of flood peaks. At Cáceres, close to the entrance to the Pantanal, there is an average of five flood peaks per year. However, the number of flood peaks decreases markedly downstream, to one at Amolar, one at Ladario, and one to two from Porto da Manga to Forte Coimbra. Downstream of Forte Coimbra, the number of peaks in creases somewhat due to local contributions. However, the locally generated peaks tend to be much smaller than the peak propagated from upstream (Hydrotechnic Corporation, 1979).
The floods in the Upper Paraguay river have been classified as follows (DNOS, 1974; Carvalho, 1986):
|
The hydrographic records at Ladario (1900-95) show the strong attenuating capacity of the Pantanal upstream of this point. Throughout the 96-yr period of record, the flood wave at Ladario has always had a 12-month duration, i.e., one rise and one recession per year (Tables 13 and 14). The rise begins usually in December and finishes in June; the recession begins in June and finishes in December. The occurrence of the flood peak at Ladario varies with the flood level; it is accelerated (to May or April) during extraordinary and exceptional floods, slowed down (to June or July) during a typical flood year (common or mean flood), and again accelerated (to April, and in rare cases, late March) during multiannual droughts. The latter behavior is due to the drought flow being mostly contained within the river banks (Section 4.1.1).
| ||||||||||||||||||||||||||||||||||||||||||||||||||||||||||||||||||||||||||||||||||||||||||||||||||||||||||||||||||||||||||||||||||||||||||||||||||||||||||||||||||||||||||||||||||||||||||||||||||||||||||||||||||||||||||||||||||||||||||||||||||||||||||||||||||||||||||||||||||||||||||||||||||||||||||||||||||||||||||||||||||||||||||||||||||||||||||||||||||||||||||||||||||||||||||||||||||||||||||||||||||||||||||||||||||||||||||||||||||||||||||||||||||||||||||||||||||||||||||||||||||||||||||||||||||
| |||||||||||||||||||||||||||||||||||||||||||||||||||||||||||||||||||||||||||||||||||||||||||||||||||||||||||||||||||||||||||||||||||||||||||||||||||||||||||||||||||||||||||||||||||||||||||||||||||||||||||||||||||||||||||||||||||||||||||||||||||||||||||||||||||||||||||||||||||||||||||||||||||||||||||||||||||||||||||||||||||||||||||||||||||||||||||||||||||||||||||||||||||||||||||||||||||||||||||||||||||||||||||||||||||||||||||||||||||||||||||||||||||||||||||||||||||||||||||||||||||||||||||||
Prediction of flood flows along the Upper Paraguay river using mathematical modeling has been attempted by DNOS (1974) and EDIBAP (1979). Under a limited budget, the DNOS model continues to be operated to this date by the Companhia de Pesquisas de Recursos Minerais (CPRM), in Rio de Janeiro. It is a difficult undertaking because of the temporal and spatial variability and complexity of the hydrologic processes, which includes high channel sinuosity, branching, overflows, endorheic surface drainage, and the presence of aquatic macrophytes in the surface waters. This is compounded by the complex nature of the interaction between surface and subsurface water, since the Pantanal has a net gain of water in a wet year, and a net loss in a dry year (EDIBAP, 1979; Adámoli, 1986).
The speed of propagation of the annual flood wave can be readily extracted from the discharge measurements. Thus, it has been established that a typical flood wave takes about 130-150 days to travel from Cáceres to Porto Murtinho. This represents an average speed of propagation of only 0.09-0.11 m/s. This extremely low value is due to the substantial contribution of channel overflows to the overall flood wave propagation (Fig. A15).
|
| Fig. A15 Flooding of the Isla Margarita, on the Upper Paraguay river, Paraguay. |
Table 15 shows low flow, mean annual, and peak flood discharges along the Upper Paraguay river. Also shown are the ratio of peak flood to low flow discharge, and peak flood to mean annual discharge. The low values of these ratios (compared to other rivers in similar climatic settings) show that the Upper Paraguay river is very effective in decreasing the flood peaks and, correspondingly, increasing the low flows. This is due to the presence of the Pantanal. Thus, the Pantanal is the geomorphic feature that provides the mechanism for the spreading (i.e., attenuation, diffusion) of flood flows and, consequently, the increased permanence of low flows.
| ||||||||||||||||||||||||||||||||||||||||||||||||||||||||||||||||||||||||||||||||||||||||||||||||||
3.3.3 Low Flows and Droughts
Table 14 shows the minimum seasonal water surface elevation at Ladario, from 1900 to 1994. The following conclusions can be drawn from these records:
The minimum seasonal flow occurs usually late during the calendar year, in the month of November or December, although occasionally it may be advanced to October, or delayed to January or February.
The minimum seasonal flow has been recorded at or below zero gage in the following years or drought periods:
In 1910 and 1915.
Five times during the nine-year drought period 1936-44.
In 1948.
Nine times during the ten-year drought period 1964-73.
As shown by the Ladario gage records, the Upper Paraguay river has a tendency toward multiannual droughts with a recurrence period of 28-30 years. The lack of more extensive data precludes a more thorough analysis. Nevertheless, the tendency is borne out by the data and should be acknowledged.
According to the EDIBAP study, the Ladario records, from 1900 through 1977, show a tendency for a decrease in both maximum and minimum seasonal flows (EDIBAP, 1979). In light of the wet period being experienced since 1974, this conclusion is in need of revision.
3.3.4 Basin Yield
The complexity of the hydrologic setting in the Upper Paraguay river precludes a detailed analysis of basin yield vs annual precipitation. However, an approximate analysis based on mean annual precipitation is possible. During a wet year, the annual precipitation P is split in three ways:
|
Deep percolation is usually small or intractable, and can be neglected on practical grounds (L'vovich, 1979). Conversely, during a dry year, annual precipitation plus (a fraction of) basin storage gointo runoff and vaporization.
A simple water balance equation can be formulated as follows:
| P = R + V � ΔS | (3.1) |
where ΔS is positive during a wet year and negative during a dry year (Adámoli, 1986a). In an average year, where change in basin storage is reduced to a minimum, the above equation reduces to:
| P = R + V | (3.2) |
from which average basin yield can be calculated.
The spatially averaged mean annual rainfall in the Upper Paraguay basin is 1,380 mm according to EDIBAP (1979), or 1,180 mm according to RADAMBRASIL (1984). This estimate is based on isohyetal maps prepared for the Brazilian portion of the basin (71%). Comparable maps for the remainder of the basin, the portion which is in Eastern Bolivia and Northwestern Paraguay, are not readily available.
The mean annual discharge at the basin mouth (see Table 12) is 1,565 m3/s.
According to DNOS (1974), the mean of six years of annual discharge measurements
(1965-71) at Porto Murtinho is
The basin drainage area at its mouth is 496,000 km2 (Section 2.2). Given this information, the mean annual runoff coefficient Kr, i.e., the ratio of runoff to rainfall, can be calculated as follows:
|
(1,565 m3/s) (86,400 s/d) (365 d/y) (1,000 mm/m) Kr = ___________________________________________________ = 0.072 (1,380 mm/y) (496,000 km2) (1,000 m/km)2 | (3.3) |
A similar calculation, assuming an intermediate value of mean annual discharge Qa = 1,700 m3/s, with P = 1,180 mm/y leads to:
|
(1,700 m3/s) (86,400 s/d) (365 d/y) (1,000 mm/m) Kr = ___________________________________________________ = 0.091 (1,180 mm/y) (496,000 km2) (1,000 m/km)2 | (3.4) |
Thus, the mean annual runoff coefficient for the Upper Paraguay basin can be taken as Kr = 0.08. That is, on an average year, runoff at the basin outlet amounts to 8% of rainfall, with the balance returned to the atmosphere as evaporation and evapotranspiration (i.e., the vaporization coefficient is Kv = 0.92). A similar analysis for the 11-year period 1965-76 showed a runoff coefficient varying in the range 7-14%, with a mean of 10% (EDIBAP, 1979).
The above calculation confirms that the Pantanal functions not only as an attenuating mechanism for flood flows (and consequent increases in low flows), but also as an abstracting mechanism for all flows, i.e., as an effective means of storing the would-be runoff and converting it instead into evaporation/evapotranspiration. Throughout millennia, this process has been responsible for sustaining the extraordinary biotic potential of the Pantanal (Tricart, 1982).
By way of comparison, the mean annual runoff at Cáceres, at the northern entrance to the Pantanal, is 382 m3/s, and the contributing drainage area is 33,860 km2 (Table 12). The mean annual precipitation of the subbasin varies from 2,000 mm at the headwaters to 1,300 mm at Cáceres (EDIBAP, 1979). This amounts to a runoff coefficient Kr = 0.22, which is 2.75 times that of the Upper Paraguay river at its mouth. Likewise, the mean annual runoff coefficient of the Paraná river at Corrientes (Argentina) has been calculated at Kr = 0.16 for the decade 1962-71, Kr = 0.19 for 1972-81, and Kr = 0.22 for 1982-91 (Ponce, 1994). These values are from 2 to 2.75 times that of the Upper Paraguay river at its mouth.
These calculations confirm that the markedly strong attenuating and abstracting property of the Upper Paraguay is due to the presence of the Pantanal, while the mean annual runoff coefficients of the Upper Paraguay river at Cáceres (immediately upstream of the Pantanal) and the Paraná river at Corrientes (964 km downstream of the Pantanal) depict more typical subhumid/humid basins.
The annual potential evapotranspiration in the Pantanal varies spatially from less than 1,100 mm to more than 1,400 mm, according to the Thornthwaite method (Alfonsi and Camargo, 1986). Measured pan evaporation data at Fazenda São João and Fazenda Rio Negro for 1971-72 shows 1,650 mm (Tarifa, 1986).
The actual evapotranspiration in an average year is estimated to be:
| Ea = 0.92 × 1,180 mm = 1,086 mm | (3.5) |
or,
| Ea = 0.92 × 1,380 mm = 1,270 mm | (3.6) |
depending on which value of mean annual precipitation is used in the calculation (Projeto RADAMBRASIL, 1984; or EDIBAP, 1979). Thus, on an annual basis, actual evapotranspiration in the Upper Paraguay basin is very close to potential evapotranspiration.
The calculation of runoff coefficient is based on surface runoff at the basin
outlet, and does not include subsurface runoff at the basin outlet, which
may be real but difficult to evaluate directly. The existence of a certain amount of
subsurface runoff is postulated on the basis that the mean annual discharge at Asunción,
on the Middle Paraguay, 542 km downstream of the Apa river confluence, is 2,700 m3/s
(INTERNAVE, 1990). The increase of more than 1,000 m3/s is difficult to explain,
particularly since there are no major intervening drainages. OEA (1975) has calculated that
the combined contribution of the Apa, Aquidabán, and Ypané rivers, which are gaged, is
about
3.3.5 Sedimentology
Measurements of suspended sediments, which include fine gravel, sand, silt, and clay particles along the Upper Paraguay river have been scanty. The longest existing records are those of Cáceres and Porto Esperança (Fig. 3).
The Cáceres data, shown in Table 16, consists of 55 once-monthly depth-integrated measurements of sediment discharge taken between March 1977 and February 1982. The Porto Esperança data, shown in Table17, consists of 52 once-monthly depth-integrated measurements taken between April 1977 and November 1981.
These measurements and related calculations were carried out by Hidrologia S.A. for the now defunct Departamento Nacional de Obras de Saneamento (DNOS). The methodologies utilized were the Modified Einstein and the Frijling-Kalinske methods.
| ||||||||||||||||||||||||||||||||||||||||||||||||||||||||||||||||||||||||||||||||||||||||||||||||||||||||||||||||||||||||||||||||||||||||||||||||||||||||||||||||||||||||||||||||||||||||||||||||||||||||||||||||||||||||||||||||||||||||||||
| ||||||||||||||||||||||||||||||||||||||||||||||||||||||||||||||||||||||||||||||||||||||||||||||||||||||||||||||||||||||||||||||||||||||||||||||||||||||||||||||||||||||||||||||||||||||||||||||||||||||||||||||||||||||||||||||||
The values shown in Tables 16 and 17 are total sediment discharge, consisting of:
Bed load, i.e., coarse particles (primarily gravel and sand) transported by rolling and sliding along the bed,
Suspended bed material load, i.e., coarse particles transported in suspension, and
Wash load, i.e., suspended fine particles, the concentration of which depends on source availability and not on the flow hydraulics.
These measurements enable the following observations regarding total sediment transport in the Upper Paraguay river:
The measured sediment concentration at Cáceres varies between 28 mg/liter and 507 mg/liter, with mean 147 mg/liter and standard deviation 122 mg/liter (Table 18).
The measured sediment concentration at Porto Esperança varies between 12 mg/liter and
897 mg/liter , with mean 176 mg/liter and standard deviation 183 mg/liter (Table 18).The correlation between sediment discharge and water discharge at both gaging stations is somewhat poor. This is partly due to the presence of the wash load, whose concentration does not depend on the water discharge. Generally, the wash load concentration is a function of the degree of natural or human-produced watershed disturbance upstream of the gaging station.
| ||||||||||||||||||||||||||||||||||||||||||||||||||||||||||||||||||||||
Table 18 includes a summary of (depth-integrated) sediment discharge measurements at gaging stations along the main tributaries of the Upper Paraguay river: Cuiabá, Piquiri, Taquari, Aquidauana, and Miranda. Figure 3 shows the location of the gaging stations. Based on this limited but significant data, a preliminary sediment budget analysis is performed in Section 4.2.
| [Note the Errata in this online edition]. |
3.4 Ecological Setting
The ecological setting of the Upper Paraguay river basin and the Pantanal of Mato Grosso is unique in the American continent. The basin is strategically located contiguous to four major South American biomes, which surround it, exerting their influence on it (EDIBAP, 1979; Adámoli, 1986b):
|
The unusual combination of geology, geomorphology, and hydrology (see Sections 3.1 to 3.3) has contributed to the richness and variety of the vegetation and associated microclimates of the Pantanal. In turn, this helps sustain a diverse group of ecosystems, where a complex assortment of permanent swamps, seasonal swamps, and terra firma is seasonally replenished with ample moisture, sediment, and nutrients. The entire process hinges on the high rate of vaporization (estimated at up to 92% on an average year) which characterizes the hydrologic budget of the Upper Paraguay river basin.
3.4.1 Flora
In the existing literature, the Pantanal vegetation is often marked as a single unit and referred to as the "Pantanal" complex. Actually, the latter is a mosaic of many different communities, with frequent abrupt changes, often correlated with topography, and many ecotones. The Pantanal has no endemic flora of its own; rather, it is made up of elements from mata (deciduous and semideciduous forests transitional to the tropical Amazon rainforest and the humid Atlantic forest), campo (open grassland), cerrado (savanna woodland), and caatinga (desert scrub forest).
There are three main vegetation zones in the Pantanal (Veloso, 1947):
|
The hydrophylous zone is permanently flooded. It is characterized by three vegetation types:
Aquatics in flowing water (Eichhornia crassipes, Pistia, Elodea);
Floating aquatics in stagnant water (Eichhornia azurea, Marsilea, Reussia subovata); and
Aquatics largely rooted in shallow water (Echinodorus spp., Hydrocleis spp., Limnocharis spp., Victoria amazonica, Ludwigia natans) (Silva and Esteves, 1993).
The hygrophylous zone is divided into: (a) permanently flooded, and (b) seasonally flooded swamps, with the latter usually dominated by one species. Plant communities of the seasonal swamps include the Thalietum (dominated by Thalia geniculata), the Cyperacietum (dominated by Cyperus giganteus), and the Ipomoe�tum (dominated by Ipomoea fistulosa).
The mesophylous zone coincides with noninundated alluvial soils. Many floristic associations occur in this soil type, as well as many transitional areas (ecotones). Veloso (1947) classified associations in order of successional development, and concluded that the region is in an active state of change toward a more mesic forest.
The most striking aspect of the Pantanal is its curious combination of mesic and xeric vegetation growing side by side, a result of its unique combination of climate and geomorphology (Tricart, 1982). Toward the center of the Pantanal, close to Corumbá, the climate is markedly seasonal, with a clearly defined drought period. Given the extremely flat topography, a small difference in elevation (one or two meters, or less) is all that is needed to make a great difference in seasonal soil moisture, particularly when the underlying strata is coarse alluvium.
Hoehne (1936) has referred to the Pantanal as a mixture of Amazonas (hylean) and Ceará (caatinga), and provided examples of the two types of flora by contrasting the gigantic candelabra cactus (Cereus peruvianus), and other cacti such as Opuntia stenarthra, with the aquatic Alismataceae and Victoria.
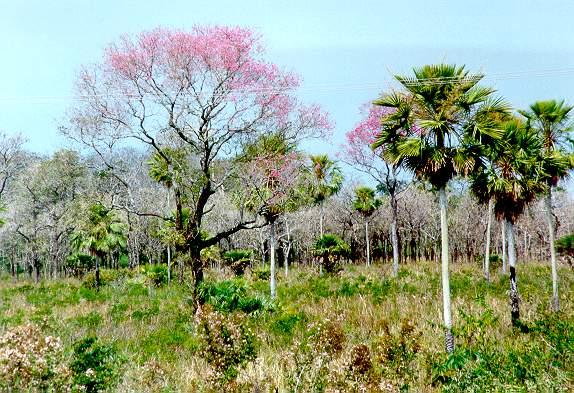
Prance and Schaller (1982) and Schaller (1983), among others, have noted the strong cerrado element in the Pantanal (Fig. A16). These cerrados are dominated by species such as Bowdichia virgiloides, Caryocar brasiliense, Curatella americana, Qualea parviflora, and Tabebuia caraiba, which are typical of the savanna woodlands (Planaltos) of Central Brazil. Cerrado occurs mainly in the nonflooded upland, but also towards the eastern edge of the Pantanal, where the land is inundated for only short periods at the height of the flood season. Such wet cerrado tends to consists of numerous islands of cerradão (dense cerrado forest) on slightly elevated areas that are not flooded.
|
| Fig. A16 Paratudal (Tabebuia aurea), near Corumbá, Mato Grosso do Sul. |
Cerrado species which are most resistant to waterlogging (e.g., Byrsonima crassifolia and Curatella americana) are common near the boundary cerrado/campo, and on raised islands of ground in wet campos (Furley and Ratter, 1988) (Fig. A17). The distribution of these islands produces the campos de murundus, consisting of an expanse of wet campos dotted with a regular pattern of raised earthmounds bearing cerrado trees, shrubs, and often termitaria. The larger earthmounds, or capões, are circular or elliptical in shape, of lengths up to 300 m, and sparsely distributed across the seasonally flooded campos (Ponce and Cunha, 1993).
|
| Fig. A17 Large vegetated earthmound in the Pantanal of Mato Grosso. |
The sharpness of the campo/cerrado boundary has been documented by Eiten (1975). Within 1 m, or even 0.5 m, the change from the shrubs and low trees of the cerrado to the grassy layer without woody plants of the campo is complete. The reason for this abrupt change appears to be that the cerrado plants cannot establish themselves from seed in continually wet soil. In general, the campo occupies a site with a lower and more fluctuating water table, whereas the cerrado occupies the higher ground, where the soil seldom if ever remains saturated. In almost all cases, the cerrado stops suddenly at the edge of the campo, apparently due to the competition between the two vegetation types as whole plant communities. Cerrado species tolerant of waterlogging are able to grow in open campos in places where the soil level is only a few centimeters higher than elsewhere. The observation that larger islands on Pantanal landscape are thickly clothed with cerrado vegetation confirms that groundwater level exerts a precise control on the cerrado/campo boundary.
In the Pantanal, the main trend of vegetational variation is highly correlated with soil moisture and topography. The patent lack of trees in the wet campos is striking, particularly since a wide range of woody species successfully colonizes both the interfluves, which are drier than the campos, and the stream sides (riparian areas, or gallery forests) which are wetter. The absence of tall, woody species from areas which are intermediate in their physical characteristics is attributed to the fluctuating nature of the water table and associated soil moisture. Thus, trees are able to tolerate both permanently wet (gallery forest) and moist-to-dry (cerrado) environmental conditions, but not an extreme alternation of saturation and desiccation (Cole, 1960). Areas subject to the latter are successfully colonized by the grassy elements (campos).
In summary, the Pantanal is extremely rich in floristic diversity and
physiognomic composition
|
| Fig. A18 Seasonally flooded savanna woodland near Miranda, Mato Grosso do Sul. |
3.4.2 Fauna
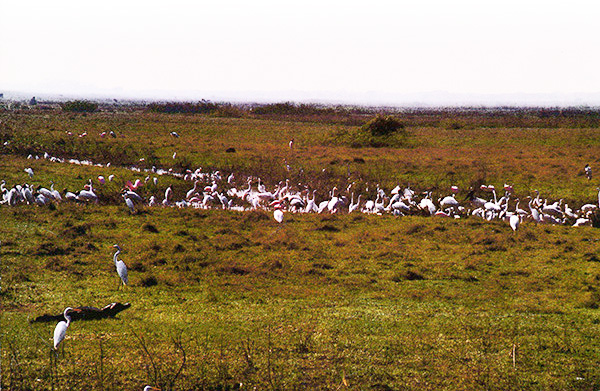
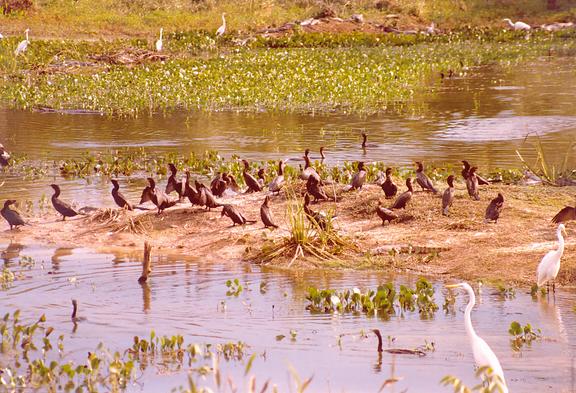
The ecological diversity of the Pantanal ecosystems has conditioned their suitability as habitat for a variety of animal species, among which are numerous species of mammals, reptiles, fish, birds, butterflies, and other invertebrates (Brown, 1986). It also serves as the resting place for many species of migratory birds from the Northern Hemisphere and other regions of South America (Antas, P. T. Z., 1983; Brown, 1986; Cintra and Yamashita, 1990).
|
| Fig. A19 Wildlife in the Pantanal of Mato Grosso. |
Terrestrial and amphibious species inhabiting the Pantanal include (EDIBAP, 1979; Bucher et al., 1993):
caiman (jacaré, Caiman crocodilus yacare)
armadillo (tatú bola, Tolypeutes tricinetus)
bush dog (cachorro do mato vinagre, Speothos venaticus)
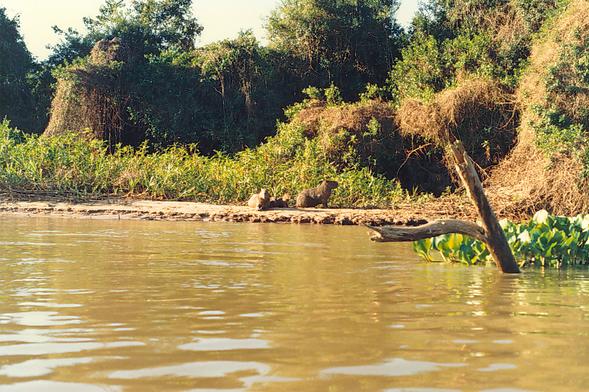
capybara (capivara, Hydrochoerus hydrochaeris) (Fig. A20)
crab-eating fox (cachorro do mato, Dusicyon thous)
giant anteater (tamandúa bandeira, Myrmecophaga trydactyla)
giant armadillo (tatú canastra, Priodontes giganteus)
giant otter (ariranha, Pteronura brasiliensis)
jaguar (onça pintada, Pantera onça)
maned wolf (lobo guará, Chrysocyon brachyurus)
marsh deer (cervo do pantanal, Blastocerus dichotomus)
neotropical river otter (lontra, Lutra longicaudis)
ocelot (jaguaritica, Felis pardalis)
pampas deer (veado campeiro, Ozotocerus bezoarticus)
rhea (ema, Rhea americana)
tapir (anta, Tapirus terrestris)
peccary (porco monteiro, Tayassu pecari).
These species selectively inhabit the campos, capões, cordilheiras, gallery forests, and water bodies (baías, vazantes, corixos) of the Pantanal. In particular, the higher ground (capões, cordilheiras) is used by terrestrial species as temporary shelter during the seasonal flooding. The impressive biodiversity of the Pantanal is due in large measure to its unusual geological, geomorphological, and hydrological setting.
|
| Fig. A20 Capybara (Hydrochoerus hydrochaeris) along the banks of the São Lourenço river, Mato Grosso. |
Wildlife management in the Pantanal has been discussed by Dourojeanni (1980), Paiva (1984), and Alho (1986), among others. Wildlife conservation in the Pantanal, particularly with regard to the jaguar (Pantera onça), has been discussed by Quigley and Crawshaw (1992).
|
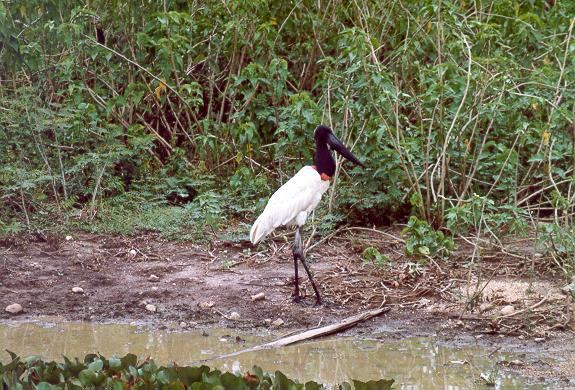
| Fig. A21 The jabiru stork, or tuiuiu (Jabiru mycteria), symbol of the Pantanal of Mato Grosso. |
4. HYDROLOGIC AND ENVIRONMENTAL IMPACT OF THE HIDROVIA PROJECT
|
|
This section evaluates the hydrologic impact of the Hidrovia project on the Pantanal of Mato Grosso, that is, the changes in water and sediment runoff to be expected as a result of project implementation. An analysis of possible downstream impacts and other related environmental impacts is included.
The evaluation is divided into four parts:
|
This section analyzes, interprets, and expands on the previous sections.
4.1 Runoff Impacts
The runoff impacts of the Hidrovia project on the Upper Paraguay river and the Pantanal of Mato Grosso can be considered under four categories:
|
Normally, the effects of natural or human-induced changes in runoff patterns are subject to evaluation using mathematical (i.e., computer) modeling. While computer modeling is routine practice in small and midsize basins, it is a complex undertaking--and often a logistical nightmare--in very large basins, particularly those located in remote and inaccessible regions. The Upper Paraguay river basin, with its 496,000 km2 (of which 145,000 km2 located in Bolivian and Paraguayan territory are largely without data), does not lend itself readily to mathematical modeling. This is due to its unusual spatial complexity, which includes high channel sinuosity, numerous bifurcations, seasonal over flows, and endorheic and often confusing drainages. In addition, there is a seasonal abundance of aquatic macrophytes in the surface waters, and an active--and for all practical purposes, intractable--interaction between surface water and groundwater.
The modeling carried out in the early 1970's by DNOS, with the technical assistance of UNDP/UNESCO, proved to be a challenge (DNOS, 1974). The SSARR model (Streamflow Synthesis And Reservoir Regulation), developed by the North Pacific Division of the U.S. Army Corps of Engineers was used to model the response of the Upper Paraguay river basin to distributed precipitation inputs (U.S. Army Engineer North Pacific Division, 1975). The objective was to develop a flood forecasting capability so that sufficient warning could be given in the event of an extraordinary or exceptional flood.
With a limited budget, the model continues to be operated to this date (1995) by the Companhia de Pesquisa de Recursos Minerais, in Rio de Janeiro. In light of the unusual complexity of the Upper Paraguay river system and adjoining Pantanal, the predictive capability of the model often falls short of expectations. The difficulty appears to be the inability of the model to adjust its parameters in real time to account for the variability of the flow (inbank, overbank, and high overbank). SSARR is a conceptual runoff model based on the cascade of linear reservoirs, while the Upper Paraguay river and adjoining Pantanal have marked two- and three-dimensional flow patterns, in addition to strong nonlinear interactions between inbank and overbank flows (Fig. A22) (Ponce, 1989). These nonlinear interactions results in the flood peak typically being accelerated during exceptional and extraordinary floods, slowed down during common and mean floods, and again accelerated during drought years (Section 4.1.1) (PORTOBRAS, 1983).
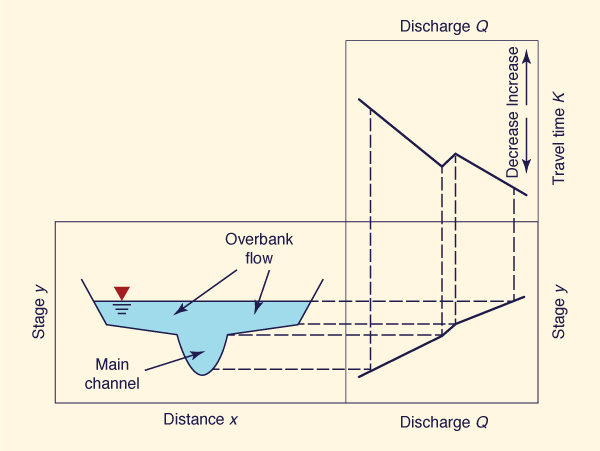
|
| Fig. A22 Nonlinear interactions between inbank and overbank flows. |
To compound its spatial diversity, the Upper Paraguay river is constantly changing its bed to adjust to changes in water and sediment discharge. Furthermore, the river is subject to geologic controls (rock outcrops and abutting rocky hills) that condition the development of its gradient in the geologic time scale. No currently available mathematical model is effectively able to account for all these features and their variabilities. This study will use analysis based on established principles of hydrology and river hydraulics to evaluate the hydrologic impact of the Hidrovia on the Pantanal of Mato Grosso.
4.1.1 Changes in Flood Regime
The question is whether the proposed navigation improvements on the Upper Paraguay river will change the river's flood regime and affect the Pantanal of Mato Grosso. The proposed navigational improvements include: (a) channel straightening by realignment and cutoffs, (b) dredging, blasting of rocky sills and other rock out crops, and (c) the possibility of hydraulic control structures (IDB, 1995). These interventions are likely to have a substantial impact on the flood regime, the degree of which will vary depending on the type and extent of intervention, and its location along the river.
In order to evaluate the impact, the needs of the Hidrovia are contrasted here with the nature of the river. The Hidrovia needs a channel sufficiently straight, wide, and deep:
Sufficiently straight, to shorten the distance of travel (that could, in turn, reduce transportation costs), and to minimize the need for cumbersome and time-consuming maneuvers around sharp bends (such as breaking the tow apart), and
Sufficiently wide and deep, to allow ample lateral space and draft for the safe passage of sea-going vessels throughout the year.
While the dimensions of the proposed navigation channel have yet to be determined, a 50-m wide, 3-m deep channel has been initially considered (CEBRAC/ICV/WWF, 1994). Whether the 3-m depth requirement will be demanded all the way to Cáceres, the furthest upstream point of the Hidrovia, is still under study.
In contrast with the first requirement of the Hidrovia, the river traces a sinuous or meandering path. (Sinuosity is defined as the ratio of river length to valley length). The sinuosity of the Upper Paraguay river varies widely, from 2.93 from 40 km downstream of Porto Conceição to Refúgio das Três Bocas, to 1.17 from Corumbá to the confluence with the Taquari Velho (Table 1). Within individual reaches, the highest sinuosity is in the vicinity of Porto Conceição, where the ends of a 50-km reach are separated by a straight distance of only 13 km, i.e., a sinuosity of 3.85 (INTERNAVE, 1990). Particularly upstream of Corumbá, where the river is more sinuous, channel straightening is likely to bring about substantial changes in the flood regime.
The effect of channel straightening on flood runoff is evaluated by examining the flood peak at Ladario, close to the center of the Pantanal (Fig. 3). Figure 8 shows a plot of peak flood stage vs date of occurrence at Ladario. [Note of the online edition: This figure has been referred to as the "boomerang-shaped cloud" by later studies of Hidrovia hydrologic and environmental impact].
The median peak flood stage for the entire period of record (1900-1995) is 4.45 m. Examination of Fig. 8 leads to the following conclusions:
|
|
|
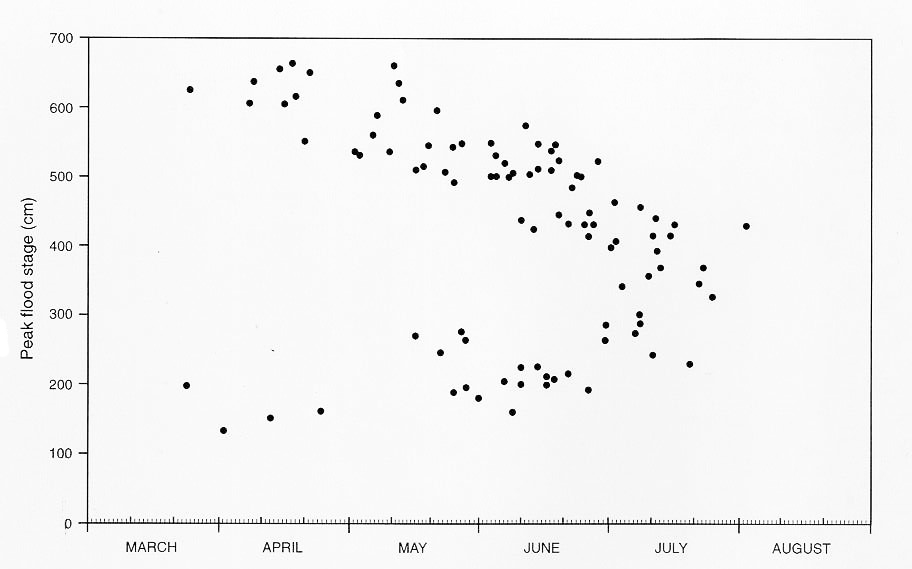
| Fig. 8 Upper Paraguay river at Ladario: Peak flood stage and date of occurrence. |
As shown in Table 13 and Fig. 8, in the past 22 years (1974-95) the median peak flood stage for the entire period of record has been exceeded 19 times, i.e., 86% of the time! The implication of this fact is that some extraordinary floods may be downgraded to mean floods, possibly due to changes in hydrologic response which may already be occurring in the basin (Section 4.1.4). Thus, it is concluded that during high mean floods (2-yr), extraordinary (4-yr) and exceptional (10-yr) floods, channel straightening will accelerate the concentration of flood runoff and increase the flood wave peak.
The sinuosity reflects the river's tendency to meander, a natural process which is conditioned by its water and sediment discharge, channel slope, and boundary friction (bed and bank friction). A decrease in sinuosity as a result of channel straightening increases channel slope, leads to changes in water and sediment discharge, and triggers morphological channel adjustments in search of a new equilibrium. Due to spatial heterogeneity, in many instances these adjustments are difficult to evaluate a priori. However, it is known that sinuosity is directly related to channel stability; therefore, a reduction in sinuosity is likely to decrease channel stability (Blench, 1986).
In contrast with the second requirement of the Hidrovia, the river provides its own width and depth, a function of its water and sediment discharge, channel slope, boundary friction, and degree of geologic control. Table 1 shows that the inbank top width of the Upper Paraguay river varies from 120 m from Boca do Bracinho to Barra do Bracinho, to 600 m from Barra do Nabileque to the Apa river confluence. Table 19, Column 3, shows measured minimum average flow depths, which vary from 1.25 m at Cáceres to 8.83 m at Porto Murtinho. (The average flow depth of a river cross section is defined as the flow area divided by the top width, Chow, 1959). These are measured minimum average flow depths (taken across the river's width), and not seasonal minimum flow depths in the deepest section of the channel, as would be required for navigation.
| ||||||||||||||||||||||||||||||||||||||||||||||||||||||||||||||||||||||||||||||||||||||||||||||||||||||||||||||||||
On the basis of Table 19, it is concluded that the Upper Paraguay river upstream of Porto São Francisco is incapable, without extensive artificial channel deepening, of accommodating ocean-going vessels (with a 3-m draft requirement) throughout the year.
Table 19 shows that downstream of Porto São Francisco, the river is sufficiently deep
even during low-flow periods. Since Porto São Francisco is very small, and located only
146 km upstream of the major commercial port of Corumbá/Ladario, the latter is
usually considered as the destination point of upstream-bound traffic. Current barge traffic
from Corumbá downstream, towards Asunción and Buenos Aires is at least two orders of
magnitude greater than the traffic from Corumbá upstream, towards Cáceres. According
to A Gazeta of Cuiabá, of February 21, 1995, only two boats with
Aside from the measured minimum average flow depths shown in Table 19, seasonal minimum flow depths in the navigation channel can be less than 3 m on several locations along the Upper Paraguay river, from Porto Murtinho to Cáceres. These locations are referred to as passos in Portuguese (a shallow or pass in English), and identified as such in navigation charts (Marinha do Brasil, 1974). Table 20 lists the 54 passes identified along the Upper Paraguay river. It is seen that 40% of these passes (22 out of 54) are concentrated in the most upstream reach, Descalvados-Cáceres, where navigation is difficult at best. The INTERNAVE (1990) report has noted that the minimum flow depth in the passes located between Descalvados and Cáceres ranges from 0.2 m to 1.5 m in dry years. Moreover, the Japuira pass, in the Porto Conceição-Descalvados reach, appears to be extremely shallow, with minimum flow depth of only 0.1 m during dry years.
| |||||||||||||||||||||||||||||||||||||||||||||||||||||||||||||||||||||||||||||||||||||||||||||||||||||||||||||||||||||||||||||||||||||||||||||||||||||||||||||||||||||||||||||||||||||||||||||||||||||||||||||||||
The bottom (bed) of the Upper Paraguay river is predominantly sandy, but with significant rock outcrops throughout its length (See Table 8). Observations of stage-discharge relations have confirmed the so-called autodredging phenomenon, by which the river seeks to maintain a minimum depth during seasonal low flows (PORTOBRAS, 1983; INTERNAVE, 1990). This autodredging mechanism functions only as long as the river is able to move its bed freely. Apparently, by adjusting the shape and configuration of its bedforms, the river is able during low flows to reduce its discharge while maintaining an approximately constant stage (and a minimum flow depth). In the Upper Paraguay river, this minimum depth is 1.2 m, except where rock outcrops do not permit autodredging to take place (PORTOBRAS, 1983). Thus, if it were not for the rocky sills, the river would produce a minimum depth of 1.2 m through out its length. To the extent that this minimum depth is violated in many places along the river, it is concluded that the slope of the Upper Paraguay river is geologically controlled.
The Hidrovia project includes channel straightening, dredging, and blasting of rocky sills (IDB, 1995). Each of these interventions is discussed here separately.
Channel Straightening
Channel straightening shorthens the path of runoff, decreases the time of
concentration, accelerates runoff concentration, and leads to increases in flood peaks.
This type of intervention in the natural channel is being considered upstream of Amolar, where the
river is more sinuous. For instance, the Internave report has proposed shortening by 62
km the distance between Cáceres (km 3,442) and Ponta do Morro (km 3,030)
(INTERNAVE, 1990). Without the necessary details, it is difficult to evaluate the
hydraulic effect of this significant intervention in the river.
Nevertheless, some approximations are
possible at this time. From Table 12, the average channel slope from Cáceres to Bela Vista
do Norte (km 3047), 17 km upstream of Ponta do Morro (Fig. 7), is:
| (110.09 m - 89.80 m) (100 cm/m) /(3442 km - 3047 km) = 5.14 cm/km |
which would increase to
| (110.09 m - 89.80 m) (100 cm/m) /(3442 km - 3047 km - 62 km) = 6.09 cm/km |
with the implementation of the proposed channel straightening.
Based on the Manning equation (Chow, 1959), and assuming for simplicity average flow conditions and a rigid boundary, this increase in channel slope represents an increase of 5% in mean velocity and a decrease of 5% in flow depth.
The effect of channel slope changes is also subject to evaluation using the well known Lane relationship, which states that the product of water discharge and channel slope is proportional to the product of sediment discharge and particle size, as follows (Lane, 1955):
| Qw S ∝ Qs d | (4.1) |
in which Qw = (water) discharge, S = channel slope, Qs = sediment discharge (taken as the sum of bed load plus suspended bed material load, excluding wash load), and d = particle size diameter. Since sediment concentration is
| Cs = Qs / Qw | (4.2) |
it follows that for a given particle size (constant d)
| Cs ∝ S | (4.3) |
i.e., an increase in channel slope will cause a proportional increase in sediment concentration. In this case,
| Cs-final / Cs-initial = 6.09 / 5.14 = 1.18 | (4.4) |
Thus, the proposed channel realignment is likely to cause an increase of close to 20% in the concentration and transport of bed material sediment.
Dredging
Dredging increases the cross-sectional area of the channel, albeit temporarily. This increases channel conveyance and the channel's ability to transport runoff (Chow, 1959). The hydraulic effects of dredging are difficult to evaluate directly, since the river reacts to dredging by adjusting its bed material load (suspended load and bed load) to eventually reach a new equilibrium. According to Jansen et al. (1982), in the long term, there will be upstream degradation, i.e., a lowering of the channel bed which will lower the groundwater level in the vicinity, resulting in a decrease in baseflow.
Blasting of Rocky Sills
Blasting rocky sills as a means of deepening the navigation channel will have an
irreversible impact on the hydrology of the Upper Paraguay river. This is the the most
significant planned intervention; if pursued, it is likely to change the
Pantanal forever. Analysis of navigation charts show that, in general, the river has been
able, through geologic time, to carve a sufficiently deep channel through most of the
rock outcrops. For instance, in the vicinity of Amolar, at km 2,958, where the river has
partly eroded into the Serra do Amolar, the flow depth can reach values greater than 14
m, cutting mostly through rock. Likewise, a short distance downstream, at
Morro Dourados (
Yet, in other places, where rocky sills protrude into the channel, the depth is shallower because the river has not yet carved an opening through these rocks. The Pantanal exists because of these rock outcrops, which influence the regional flow patterns in at least three places: Amolar, Porto da Manga, and Fecho dos Morros (Section 3.3.1). In particular, the hump at Amolar, together with a possible geologic control in the vicinity of the exit of Lagoa Gaíba, are instrumental in the creation of the Pantanal of Paiaguás, an important region of biological species diversity (Fig. 4).
The extent to which bed profile convexities (humps) can cause backwater in the Upper Paraguay river can be estimated using principles of open-channel hydraulics (Chow, 1959). Table 21 summarizes water surface profile computations for Amolar and Porto da Manga, where significant humps have been identified (Section 3.3.1). A hypothetical prismatic channel is assumed for simplicity. The hump at Amolar (47 cm) is shown to increase the flow depth up to a distance of 339 km (99% of downstream depth increase), which could affect the stage as far upstream as Descalvados. Likewise, the hump at Porto da Manga (44 cm) increases the flow depth up to a distance of 417 km, which could affect the stage as far upstream as Bela Vista do Norte. These calculations confirm that relatively minor changes in grade, which would necessarily take place as a result of blasting rocky sills, can affect the upstream hydraulics to greater lengths than may have been anticipated.
| ||||||||||||||||||||||||||||||||||||||||||||||||||||||||||||||||||||||||||||||||||||||||||||||||||||||||
The great extent of the backwater profile is the reason why proposals for artificial control structures (e.g., dams, levees, and polders) in the Upper Paraguay river and Pantanal are usually controversial. Their permanent flooding of extensive adjoining areas which were either previously dry or only seasonally flooded can hardly be justified (Silva, 1990). For the same reason, proposals for the artificial removal of rocky sills, which act as natural dams, are also controversial. If implemented, they will dry out extensive areas which were normally subject to seasonal flooding. The point to emphasize with regard to the Pantanal is that any change will have wide-ranging spatial impacts.
Besides being irreversible, the blasting of rock outcrops may prove to be unsustainable in the long run. The elimination of a rocky sill will cause upstream channel degradation until a new equilibrium bed, lower than the initial level, is attained (Jansen et al., 1982). This will lower the groundwater level and reduce the baseflow. More importantly, however, the removal of one rocky sill may lead to the appearance of another rocky sill which was previously submerged (Jansen et al., 1982) (Fig. A23). This is a definite possibility in the Upper Paraguay river, which has a rock outcrop every 40 km on the average (Table 8), and where the prevailing channel slopes are so mild (1-2 cm/km) that the backwater effect of a 0.5-m flow obstruction may be felt for about 400 km upstream (Table 21).
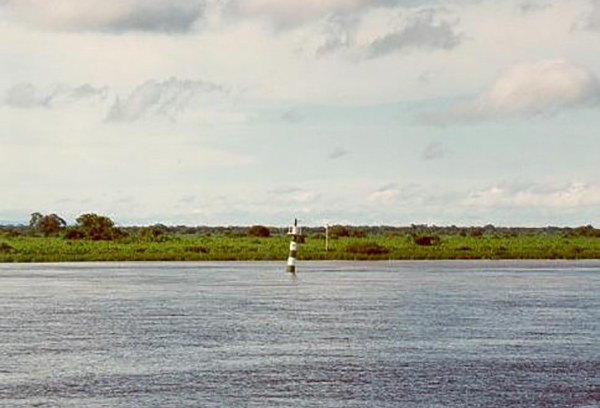
|
|
Fig. A23 Farolete Balduíno, on the Upper Paraguay river, near Corumba, Mato Grosso do Sul. |
In summary, the following is concluded:
|
If implemented, these actions will have more serious impacts upstream of Corumbá/Ladario, particularly upstream of Porto São Francisco, where minimum flow depths are well below the proposed 3-m channel depth required for the navigation of ocean-going vessels.
4.1.2 Changes in Baseflow
A well known principle of hydrology is that changes in flood regime produce changes in baseflow. This principle is predicated on the observation that the higher the flood peak, the lower the baseflow; conversely, the lower the flood peak, the higher the baseflow. The rationale for this inverse relation is that a drop of rainfall that does not make it into the basin surface runoff is retained as basin wetting (Ponce and Shetty, 1995a), to follow one of two possible paths:
Return to the atmosphere as evaporation or evapotranspiration, or
Percolate through the soil profile and eventually exfiltrate to the drainage network in the form of interflow or groundwater flow. The fraction of runoff which follows the path of groundwater flow is referred to as baseflow.
Thus, on the average, a drop of basin wetting has about a 50% chance of becoming baseflow. While the baseflow-wetting relations for the Upper Paraguay river remain to be established, a subhumid basin such as the Upper Paraguay does have a substantial baseflow component. It is noted that the minimum measured discharge at Porto Murtinho is 549 m3/s (Table 13). The well-known sponge effect of the Pantanal on the Upper Paraguay river (Bucher et al., 1993) is partly accounted for by the conversion of the faster surface runoff into slower subsurface runoff.
It follows that accelerating the concentration of flood runoff and increasing the flood peaks will produce a decrease in baseflow, which will lead to decreases in minimum flow depths, particularly in those locations where the self-dredging action is minimal or nonexistent. In the absence of more detailed studies, it is difficult to ascertain the extent of this decrease, but the tendency is there and must be acknowledged.
Changes in baseflow regime (either losses or gains), although in smaller catchments, have been documented in the United States and other countries (for a recent review, see Ponce and Lindquist, 1990). Generally, a decrease in environmental moisture (i.e., less precipitation, less vaporization, and less total runoff) leads to baseflow losses, while an increase in environmental moisture (more precipitation, more vaporization, and more to tal runoff) leads to baseflow gains. The amount of baseflow is shown to be highly correlated with climatic regime. Loss of baseflow invariably leads to climatic changes in the direction of greater aridity.
The issue of potential changes in baseflow is extremely relevant as far as the feasibility (and sustainability) of the Hidrovia project is concerned, since extensive channel modifications will lead to increases in high flows (flood peaks), which in turn will lead to decreases in low flows (which are mostly baseflow). Thus, it is expected that channel modifications (straightening, dredging, and blasting of rocky sills) will destabilize the river's baseflow regime. In turn, this will demand additional future action to continue to maintain the required minimum draft, i.e., it will set in place a vicious circle of channel interventions. This is an extremely serious issue, since it can potentially jeopardize the existence of the Pantanal.
4.1.3 Changes in Water Yield
The Upper Paraguay river has a mean flow of 1,565 m3/s. This value was estimated at the Apa river confluence, based on existing measurements at Porto Murtinho and Fecho dos Morros (Table 12). Based on estimates of spatially averaged mean annual precipitation, a runoff coefficient of Kr = 0.08 (the ratio of runoff to rainfall) has been calculated (Section 3.3.4). How will this runoff coefficient be affected by the execution of the Hidrovia project? In the absence of detailed hydrologic analyses, experience with neighboring basins can provide useful guidelines as to the possible impacts.
The relationship between the runoff coefficient Kr and the annual precipitation P is a characteristic of each basin, with dKr /dP being always positive, i.e., the runoff coefficient increases with annual precipitation (Ponce and Shetty, 1995b). This function is part of the basin's hydrologic signature, a characterization of its annual water yield or basin response to the given precipitation input. Changes in flood regime and baseflow (in creases in flood peaks and consequent decreases in baseflow) may produce changes in mean flow regime, and eventually lead to climatic changes, i.e., changes in
Annual precipitation amounts, patterns, and spatial and temporal distribution,
Evaporation/evapotranspiration amounts,
Floristic species composition, a function of moisture content in soil and atmosphere, and
Runoff nature (i.e., surface vs subsurface) and amounts.
For instance, the Paraná river at Corrientes, Argentina (Middle Paraná) (Fig. 1) has seen its runoff coefficient increase from Kr = 0.16 in the decade of 1962-71 to Kr = 0.22 in 1982-91, an increase of more than 35% in about 20 years (Ponce, 1994). Part of this increase may be accounted for by increases in annual precipitation (Anderson et al., 1993), while another part may be attributed to land use changes (Ponce, 1994).
Changes in land use which have the effect of increasing surface runoff have been occurring in the Upper Paraná basin since the late 1960's, when the land was converted from coffee plantations to the production of soy beans and sugar cane. In Eastern Paraguay alone, upstream of Confluencia, forest cover has decreased from 55% in 1945 to about 15% today (Anderson et al, 1993). Confirming this trend, similar increases in mean annual runoff (34% in the 20-yr period 1971-90, using the data for the 40-yr period 1931-70 as the baseline) have been recently documented at Itaipú Dam, on the Upper Paraná (N. Carvalho, personal communication, 1995). Thus, it is concluded that basin/river interventions that have the effect of increasing and/or accelerating surface runoff produce significant changes in the long-term hydrologic response of a basin. Such changes may eventually produce climatic changes in the direction of greater aridity (See Section 4.4.1).
On the basis of the recent Paraná experience, it is expected that the Hidrovia project will, in the short term, increase the mean annual runoff coefficient above 0.08, thereby reducing the vaporization coefficient below 0.92. The reduction in evapotranspiration amounts will have a negative impact on the vegetative biota. It will lead to decreases in actual evapotranspiration, and, through species displacement, to increases in potential evapotranspiration, followed by decreases in annual precipitation and environmental moisture (the moisture present in soil and air). The extent and timeframe of these potential climatic changes remains to be ascertained.
The response of a river system is the result of complex interactions between the hydrology of the upland subbasins (the supply of runoff, both water and sediment, to the drainage system) and the hydraulics of the drainage system (the channel characteristics, i.e., width, depth, slope, and boundary roughness, both form and grain roughness). In the Upper Paraguay, channel slope is controlled by the local geology, while channel widths and depths have adjusted through millennia to the prevailing water and sediment discharge, channel slope and boundary roughness.
To give an example, the reach from Boca do Bracinho to 40 km downstream of Porto Conceição, a distance of 146 km along the river, is only 120-150 m wide (Table 1). This unusually narrow reach is due to the intervening overbank flows (both water and sediment). The overbank flows reduce the mean annual discharge, from 437 m3/s up stream, at Descalvados, to 341 m3/s at Porto Conceição, and to 144 m3/s further downstream, at Bela Vista do Norte (Table 12). Frequently, this reach (from Boca de Bracinho to 40 km downstream of Porto Conceição) is temporarily obstructed by floating islands of biomass which originate in the numerous neighboring baías (Fig. A24). The seasonality of these obstructions, which are regionally referred to as batume or bacero, have been studied by Silva and Esteves (1993).
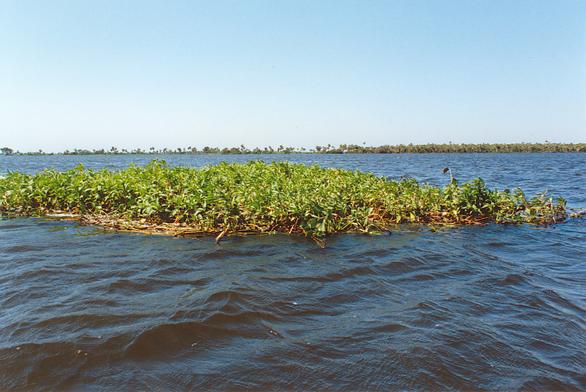
|
| Fig. A24 Floating vegetation (camalotes) on the Upper Paraguay river. |
Changing the river channel dimensions (width and/or depth) through dredging will trigger changes in water and sediment discharge and an eventual adjustment to the new conditions. Pending detailed studies, a reference assessment of the hydrologic impact can be accomplished by assuming a rectangular 300-m wide, 1.5-m depth natural channel, applicable upstream of Amolar, with flow area
| Ainitial = (300 m) (1.5 m) = 450 m2 | (4.5) |
A 50-m wide 3-m deep navigation channel will increase the flow area to
| Afinal = 450 m + (50 m) (1.5 m) = 525 m2 | (4.6) |
Asumming for simplicity constant channel slope and boundary roughness, the flow area ratio
| Afinal / Ainitial = 525 / 450 = 1.17 | (4.7) |
leads, through the use of the Manning equation (Chow, 1959), to
| Qfinal / Qinitial = (Afinal / Ainitial)5/3 = 1.3 | (4.8) |
i.e., to an increase of 30% in water discharge.
The assumed 1.5-m minimum channel depth tends to be low in most cases where the river is actively moving its bed (a sandy channel bottom), and high in places where there are significant rock outcrops encroaching into the channel. Detailed bathymetric data and analysis throughout the length of the Upper Paraguay river, particularly in the regions of more intensive channel intervention (the passes proposed to be dredged or blasted), will be required to further refine this assessment.
4.1.4 Changes in Drought Regime
The flood regime of the Upper Paraguay river and adjoining Pantanal is characterized by one annual flood pulse, the rise of the flood wave rise lasting up to six months. This is certainly the case at Amolar and Ladario, both of which are strategically located near the center of the Pantanal (Fig. 2). The annual flood wave varies in magnitude and time of peak occurrence (see Section 4.1.1).
The longest streamflow records for the Upper Paraguay river are at Ladario, where stage and discharge measurements have been made since the turn of the century. The Ladario records show the presence of several multiannual drought periods, i.e., periods of unusually low flows, each lasting several years. Examination of the record enables the identification of three such drought periods: 1909-16, 1936-44 and 1964-73 (Fig. 9). The sparseness of the data precludes a more precise definition of the recurrence interval; however, the data appears to suggest that the Upper Paraguay and Pantanal begin a multiannual drought roughly every 30 years on the average. Following this reasoning, the next drought period is now overdue in the Pantanal. The persistence to this date of the wet period which began in 1974 could be partly attributed to hydrologic changes which may already be taking place in the Upper Paraguay basin, due to changes in land use (Silva, 1990). In this regard, Silva et al. (1995) have recently documented an exponential rate of deforestation in the Pantanal. Additional study is urgently needed in this area.
|
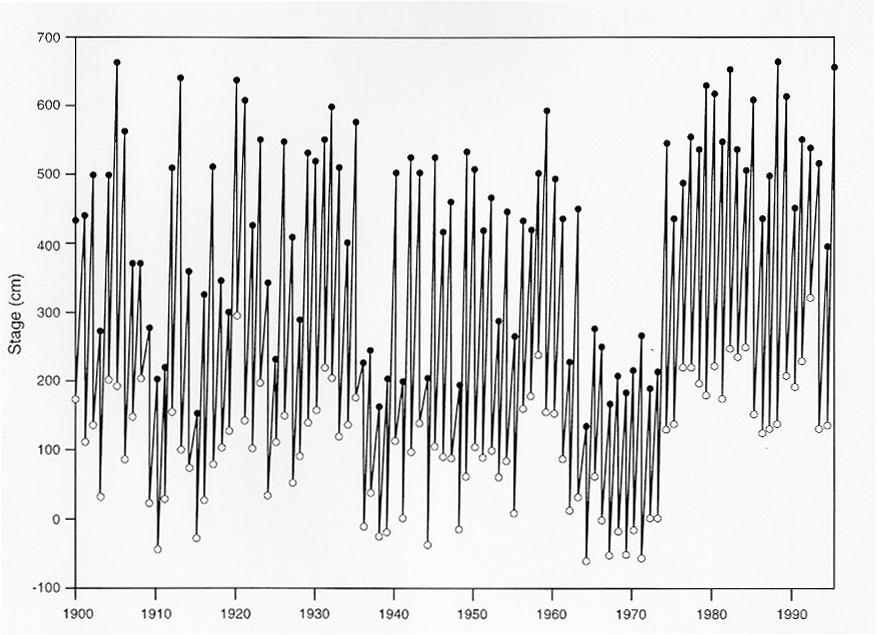
| Fig. 9 Upper Paraguay river at Ladario: Recorded seasonal maximum and minimum stages.. |
|
| Fig. 9a Upper Paraguay river at Ladario: Recorded seasonal maximum and minimum stages. |
How will the Pantanal's drought regime be affected if the floods in the Upper Paraguay are exacerbated by the projected Hidrovia? In the absence of additional data and more detailed analysis, this remains an open question. However, it is instructive to compare the Pantanal experience with that of other basins in Brazil, across the climatic spectrum. For instance, a semiarid region such as the Brazilian Northeast is subject to multiannual drought periods which recur once every eleven years on the average (Guerra, 1981; Ponce, 1995). Moreover, the intervening floods are often disastrous in terms of loss of life and property. On the other hand, a humid tropical region such as the Lower Amazon basin is annually visited by one flood pulse of predictable magnitude and regularity, while being hardly affected by river droughts (Richey et al., 1989). Thus, the sequence of floods and droughts is shown to be a characteristic of the climatic regime, wherein floods predominate over droughts in subhumid and humid regions, while the converse holds true for arid and semiarid regions.
It is hypothesized that increases in flood magnitude, to be expected as a result of the Hidrovia project, will change the multiannual drought regime in such a way that droughts will be more intense and recur more often. If this climatic change sets in, the Hidrovia project will prove to be unsustainable in the long run. The accumulation of structural interventions in the river (channel straightening, dredging, and blasting of rocky sills) will promote the intensification of floods and droughts, increase the difference between seasonal maximum and minimum stages (Fig. 10), and decrease usable flow depths during the increasingly pronounced low-flow season.
|
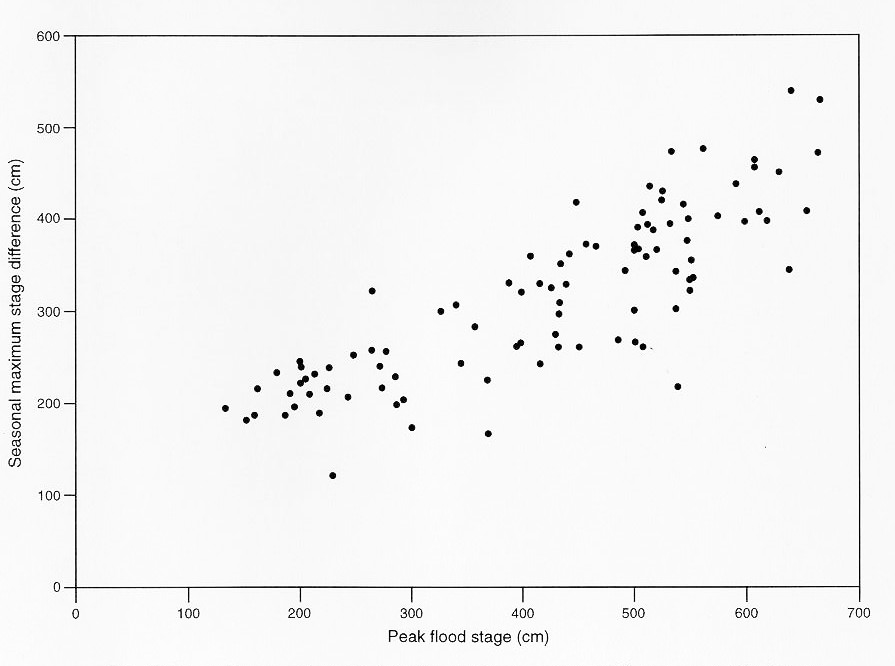
| Fig. 10 Upper Paraguay river at Ladario: Seasonal maximum stage difference vs peak flood stage. |
In conclusion, the acceleration of runoff concentration caused by navigation improvements will intensify high mean, extraordinary and exceptional floods, potentially reduce the recurrence interval of drought periods, and may eventually lead to climatic changes in the direction of greater aridity (lesser precipitation, lesser evaporation/evapotranspiration, and lesser runoff amounts).
4.2 Sediment Impacts
The sediment impacts of the Hidrovia project on the Upper Paraguay river and the Pantanal of Mato Grosso can be considered to fall into two categories:
Changes in sediment discharge due to changes in flood regime
Changes in sediment discharge due to long-term climatic changes.
It is generally recognized that the Upper Paraguay river basin functions to date as an extensive surface of sediment accumulation. The sediment entering the basin by way of the tributaries (Cuiabá, Taquari, and Miranda, to name the most important) is distributed by channel overflows on the coalescing alluvial fans, and/or trapped in the numerous wetlands and endorheic drainages of the Pantanal.
The highly dissected plains (planaltos) of Mato Grosso and Mato Grosso do Sul have,
through millennia, contributed a healthy supply of sediment to the neighboring lowlying
Pantanal (Fig. A25). For instance, the Taquari river carries a sizable sediment load, which at times
can be as high as
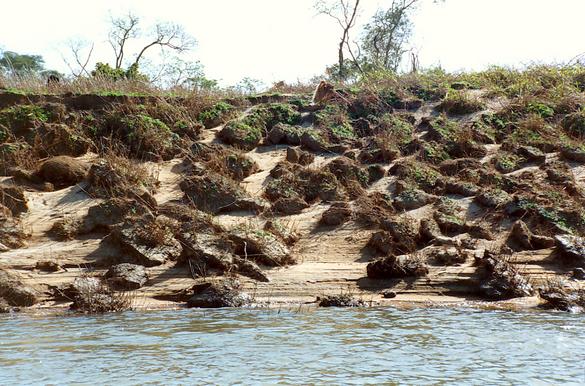
|
| Fig. A25 Bank erosion on the Apa river. |
Monthly depth-integrated sediment discharge measurements along the Upper
Paraguay river and its major tributaries have been performed for DNOS by Hidrologia S.A.
for a 5-year period spanning the late 70's and early 80's. A summary of these
measurements is shown in Table 18. Significantly, the measured mean sediment
concentration at Porto Esperança, downstream of the major Upper Paraguay tributaries, is only
176 ppm. This value should be compared with the measured mean sediment
concentration entering the Pantanal through the tributaries: 235 ppm for the Cuiabá,
The poor correlation between sediment discharge and water discharge (refer to Tables 16 and 17) may not sufficient grounds to disqualify the sediment data. The data shown in these tables is total sediment load, which includes fine sediment load (wash load), a function of upstream supply (degree of upper basin natural or anthropogenic disturbances), and not of the flow hydraulics (depth and velocity). In the absence of channel overflows, once the wash load gets into the channel, its tendency is to remain there to be eventually exported from the terrestrial ecosystem(s). In addition, the monthly sediment data record has implicit within it the hysteresis in the sediment rating, i.e., the tendency of the flow to transport more bed material load during the rising stage than during the receding stage (Leopold et al., 1964). Thus, monthly sediment data is only an approximate indication of the sediment budget of a basin.
4.2.1 Changes in Sediment Discharge due to Changes in Flood Regime
In general, changes in flood regime produce changes in sediment discharge. This is a well known principle of hydrology, having been amply documented for many decades (U.S. Department of Agriculture, 1940). However, due to nonlinear interactions between stage and mean velocity, the nature of this relationship is not readily apparent in the Upper Paraguay river. During common and low mean floods, increases in stage may reduce mean velocity and delay the occurrence of the flood peak to late June, July, or early August, reducing sediment transport and export from the basin. On the other hand, during high mean, extraordinary and exceptional floods, increases in stage will increase mean velocity and accelerate the occurrence of the flood peak to early June, May, April, or late March, increasing sediment transport and export from the basin (Section 4.1.1).
Aside from the complexities of sediment transport in the Upper Paraguay river,
increases in mean velocity invariably lead to increases in sediment transport capacity. The
relationship between sediment (bed material) discharge (Qs) and mean velocity (v)
is
highly nonlinear, the exponent of mean velocity varying in the range 3-7 (Colby, 1964).
Thus, a 5% increase in mean velocity (Section 4.1.1) amounts to a 15-40%
increase in sediment discharge, as follows:
| Qs-final / Qs-initial = (vfinal / vinitial)3 = (1.05)3 = 1.15 | (4.9) |
| Qs-final / Qs-initial = (vfinal / vinitial)7 = (1.05)7 = 1.40 | (4.10) |
This indicates that increases in runoff and flow velocities will lead to proportionally larger increases in sediment loads and, consequently, in sediment export from the basin. To give an example, the increasing sediment loads reaching the Lower Paraná in the past two decades (H. Benito, personal communication, 1995) appear to be the result of increasing water yield in the Upper Paraná (Anderson et al., 1993; Ponce, 1994).
4.2.2 Changes in Sediment Yield due to Long-term Climatic Changes
In the long term, climatic changes in the direction of greater aridity (from dry subhumid to semiarid in the case of the Pantanal) will lead to increases in sediment yield, i.e., the sediment discharge at an evaluation point, integrated over the entire year. It is widely recognized that the sediment yield from a drainage basin peaks at an annual precipitation P of about 12 in. (304.8 mm) (Langbein and Schumm, 1958); or, alternatively, at an annual runoff Q of about 2 in. (50.8 mm) (Dendy and Bolton, 1976).
An arid climate (P between 50 and 250 mm) has lesser rainfall and runoff, and consequently, a lower capacity to entrain and transport sediment. A semiarid climate (P between 250 and 500 mm) encompasses the peak of sediment yield. Subhumid (P between 500 and 1,000 mm), humid (P between 1,000 and 2,000 mm), and extremely humid (P greater than 2,000 mm) climates have greater rainfall and runoff, but in these cases erosion is controlled by the increasingly abundant vegetation (Bull, 1991).
The Dendy and Bolton method is used in the United States to calculate sediment yield from ungaged catchments (Dendy and Bolton, 1976). The method specifies a runoff threshold Qt = 2 in., below which sediment yield is directly related to annual runoff Q (by a power function), and above which sediment yield is inversely related to Q (by an exponential decay function). Thus, sediment yield increases as annual runoff approaches the threshold value of 2 in. from either side, i.e., increasing to 2 in., or decreasing to 2 in.
The power function is:
| S = 1280 Q 0.46 (1.43 - 0.26 log A) | (4.11) |
applicable for Q less than Qt.
The exponential decay function is:
| S = 1965 e-0.055 Q (1.43 - 0.26 log A) | (4.12) |
applicable for Q greater than Qt. In these equations, S = sediment yield (ton/mi2/yr), Q = liquid runoff (in.), and A = drainage area (mi2).
These formulas were developed for small and midzise catchments in the United States, and their applicability to the Upper Paraguay basin remains to be established. Nevertheless, the pattern of sediment yield changes with climatic change is general and should be recognized across geographical boundaries.
In conclusion, long-term climatic changes in the direction of greater aridity will lead to increases in sediment yield in the Upper Paraguay basin. Normally, climatic changes are slow and not readily amenable to evaluation using conventional mathematical modeling. However, if a climatic change sets in, it will offset the flow depth gains implemented by the Hidrovia project. This is a significant impact, which could affect the sustainability of the project over the long term.
4.3 Impact on the Flood Regime of the Middle Paraná River
There is some concern that changes in the flood regime of the Upper Paraguay river may increase flood magnitudes downstream, in the Middle Paraná (Bucher et al., 1993). The Pantanal delays runoff peaks from the Upper Paraguay by three months or more, such that they are out-of-phase with runoff peaks from the Upper Paraná arriving at Corrientes (Fig. 1). Compounding this concern, flood peaks and annual runoff volume are already on the increase in the Upper Paraná. The marked increase (34% in the past 20 years) has been attributed to increases in precipitation and land-use changes in the Upper Paraná and Middle/Lower Paraguay rivers, and not necessarily to changes in the Upper Paraguay (Anderson et al., 1993; Ponce, 1994).
The Paraná-Paraguay river basin is part of the La Plata basin system, and its most important in terms of both discharge (75%) and catchment area (84%) (Section 2.1). The La Plata basin system is enclosed within two large climatic zones (OEA, 1969): (1) tropical zone (V), and (2) subtropical temperate/warm zone (IV), with the following subzones (Fig. 11):
|
|
|
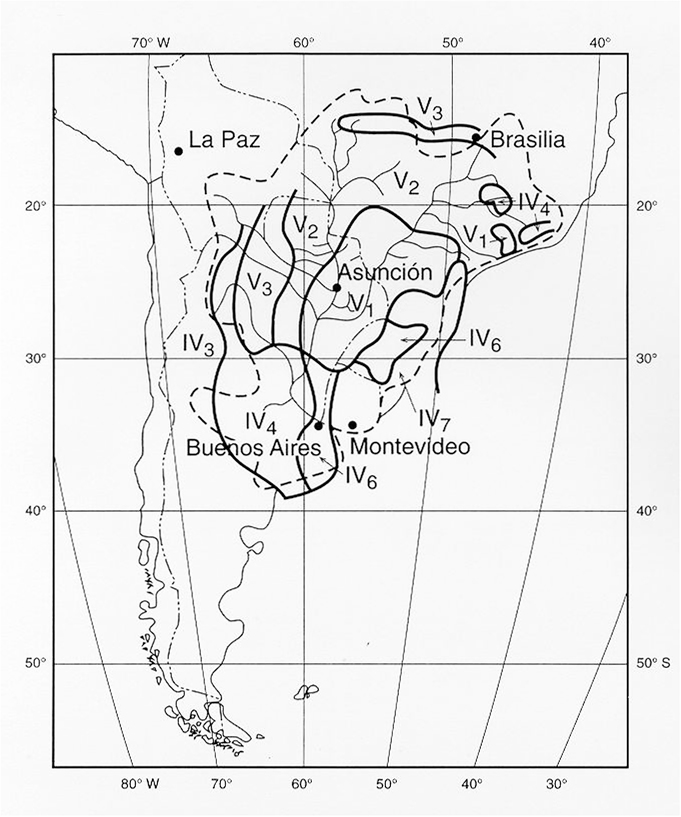
| Fig. 11 Climatic zones of the La Plata basin system (OEA, 1969). |
Figure 11 shows the following: (1) most of the Upper Paraguay basin lies within the tropical subzone V2 (Brazil, in Mato Grosso and Mato Grosso do Sul); (2) most of the Middle and Lower Paraguay basins lie within the tropical subzones V1 (Paraguay, east of the Paraguay river) and V3 (Paraguay, Argentina, and Bolivia, west of the Paraguay river); and (3) most of the Upper Paraná (Brazil) basin lies within the tropical subzone V1.
Thus, the rainfall regimes of the Upper Paraguay, the Middle/Lower Paraguay, and the Upper Paraná rivers are quite different. Rainfall in the Upper Paraguay is concentrated in the summer months. According to the EDIBAP study, the wettest three-month period is December-February, representing 48% of total rainfall in the north of the basin (Cáceres), gradually decreasing to 36% in the south of the basin (Porto Murtinho) (Section 3.3.2) (EDIBAP, 1979). On the other hand, rainfall in the Middle/Lower Paraguay (Eastern Paraguay) and Upper Paraná basins is more evenly distributed throughout the year.
Table 22 and Fig. 12 show monthly distributions of measured annual flood peaks at key stations along the Paraguay and Paraná rivers. Three stations are listed in the Upper Paraná: (1) Cáceres, at the entrance to the Pantanal; (2) Ladario, next to Corumbá, downstream of the Pantanal of Paiaguás and the Pantanal of Cuiabá-Bento Gomes-Paraguaizinho (Fig. 4); and (3) Porto Murtinho, close to the mouth of the Upper Paraguay river. One station is listed in the Middle Paraguay (Asunción, Paraguay), another in the Upper Paraná (Posadas, Argentina), and another in the Middle Paraná (Corrientes, Argentina). The lack of data sets of comparable length (the record length varies from 20 years at Cáceres to 96 years at Ladario) imposes a limitation on the analysis, which is not readily resolved, since this is the only available data.
| ||||||||||||||||||||||||||||||||||||||||||||||||||||||||||||||||||||||||||||||||||||||||||||||||||||||||||||||||||||||||||||||||||||||||||
|
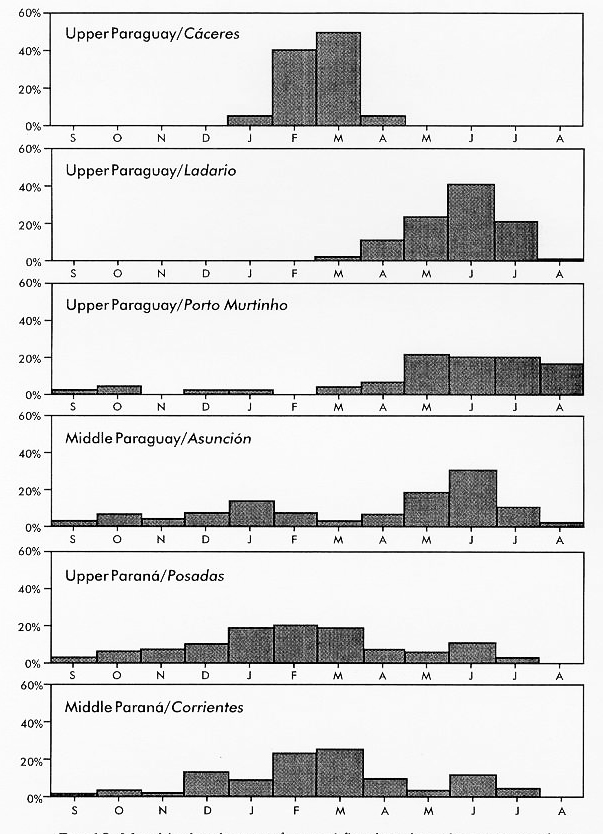
| Fig. 12 Monthly distribution of annual flood peaks at key stations along Paraguay and Paraná rivers. |
The distances along the Hidrovia are: Corrientes, km 1,208; Asunción, km 1,630; Porto Murtinho, km 2,235; Ladario, km 2,755; and Cáceres, km 3,442. Furthermore, Posadas (Fig. 1) is located 378 km upstream of Corrientes, on the Upper Paraná.
Table 22 shows that 50% of the annual flood peaks measured at Cáceres
occurred in March (and 90% in the period February-March), while 41% of
those in Ladario occurred in June (and 86% in the period May-July). This shows
that it takes about 105 days on the average (end of February to middle of June) for the
flood peak to travel from Cáceres to Ladario, a distance of 687 km, at a speed of
The calculation of the flood wave speed from Ladario to Porto Murtinho is complicated by the effect of local contributions. For instance, the mode of the distribution at Porto Murtinho occurs in May, but the distribution is strongly represented throughout four months (May to August), while that of Ladario occurs predominantly in June. Furthermore, while 23% of the annual floods at Porto Murtinho peaked late in the season (August to October), only 1% of those at Ladario peaked late (August) (Table 13). Thus, the delay of the flood peak from Ladario to Porto Murtinho is not clearly discernible by the record, although there is enough reason to believe that it may be up to two months or more (Carvalho, 1986) (Fig. A26).
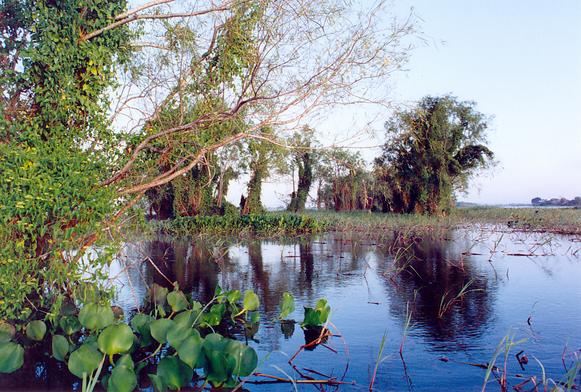
|
| Fig. A26 Flooding on the Upper Paraguay river near Porto Murtinho, Mato Grosso do Sul. |
Figure 12 shows that the annual flood peak at Asunción, on the Middle Paraguay, can occur at any time throughout the year, with no clearly defined dry period. On the other hand, a clear dry period was the case of Cáceres (May-December) and Ladario (September-February). The highest frequency of annual floods in Asunción is in June (29 percent), followed by May (17%), and January (13%). Since the Upper Paraguay river does not contribute to the January flood peaks at Asunción, the latter must originate in local contributions of the Middle Paraguay, including that of the Apa.
The measured stage hydrographs at Ladario and Asunción are quite different. Those at Ladario are unimodal, showing one annual flood peak (around midyear) and little variability in low flow (around the end of the year). Those at Asunción are multimodal, showing several hydrograph peaks and valleys throughout the year, an annual flood peak being possible at any time of the year (PORTOBRAS, 1983). Closer examination of the hydrographic records shows that at least some extraordinary and certainly all exceptional flood waves at Ladario are also felt as such at Asunción. For instance, the 1980 flood peaked at Ladario on April 18, at Porto Murtinho on July 1, and at Asunción on July 10 (PORTOBRAS, 1983).
Thus, it is expected that extraordinary and exceptional flood peaks at Porto Murtinho, on the Upper Paraguay, will be felt both at Asunción, on the Middle Paraguay (605 km downstream of Porto Murtinho), and at Corrientes, on the Middle Paraná (422 km downstream of Asunción).
Table 22 and Fig. 12 show that the annual flood peak at Posadas, on the Upper Paraná, can occur throughout the year, with no clearly defined dry period. However, unlike Asunción, which shows a mode of 29% in June, the mode at Posadas is in February, and only 19%. Thus, runoff from the Upper Paraná reaches Posadas typically in mid- to late summer (January-March). Runoff from the Upper Paraná and Paraguay rivers join together at Confluencia, and is measured at Corrientes (Argentina), 32 km downstream. At Corrientes, the highest frequency of annual floods is in March (25%), followed by February (23%), December (12%), and June (11 percent). Thus, a flood peak at Corrientes can originate in one of three sources:
Runoff from local contributions, peaking in December.
Runoff from the Upper Paraná, peaking in February or March.
Runoff from the Paraguay basin, peaking in June or July.
The latter includes some extraordinary and all exceptional floods in the Upper Paraguay river basin, which are attenuated by the Pantanal into a unimodal flood wave.
The preceding analysis leads to the following conclusions:
|
The Hidrovia project will accelerate the concentration of flood runoff in the Upper Paraguay during high mean, extraordinary and exceptional floods. This will lead to higher and earlier flood peaks at Ladario, occurring typically in May or April, instead of June or July. The extent to which an increase of the flood peak at Ladario (and, consequently, at Porto Murtinho) will lead to an increase of the flood peak at Corrientes remains to be determined. Mathematical modeling (flood routing) will be required to ascertain the precise nature of this increase.
In the absence of detailed modeling, the present conclusions regarding downstream effects of the Hidrovia project should be regarded as preliminary:
-
Significant interventions in the Upper Paraguay river, with the potential to jeopardize the existence of the Pantanal, will increase and accelerate extraordinary and exceptional flood peaks at Ladario and Porto Murtinho, and contribute to a substantial increase in the summer flood peak at Corrientes (February or March).
-
Less significant or limited interventions in the Upper Paraguay river will increase and accelerate extraordinary and exceptional flood peaks at Ladario and Porto Murtinho, and contribute to an increase in the summer flood peak at Corrientes. The precise extent of this increase remains to be determined by further analysis.
4.4 Other Related Environmental Impacts
Other related environmental impacts of the Hidrovia project include the following:
|
Changes in the hydrologic regime (magnitude and frequency of floods and droughts, and changes in water yield) of the Upper Paraguay river will have an impact on the thermal balance of the lower atmosphere, through changes in the mean albedo. Changes in the sediment balance will impact the nutrient balance, which in turn, will affect the vegetative biota (species composition and diversity) and modify, through displacement, animal populations (birds, reptiles, and mammals) and habitats (Section 3.4.2). The impact of these changes is wide ranging and long term, deserving of a thorough study prior to project implementation.
4.4.1 Impact on the Mean Albedo of the Upper Paraguay Basin
Changes in the mean flow regime of the Upper Paraguay river will result, in the long term, in an increase in the mean albedo of the Upper Paraguay basin. (Albedo is the reflectivity coefficient of a surface, i.e., the ratio of the total reflected short wave radiation flux to the total downwelling solar flux, Fig. A27). The increase in albedo will cause changes in the thermal balance of the lower atmosphere, and will eventually lead to climatic changes in the direction of greater aridity (Charney, 1975). Thus, mean annual precipitation and mean annual runoff will be eventually reduced, resulting in the reduction of flow depths in the Upper Paraguay river, and the shrinking of the Pantanal. Currently, the mean annual precipitation in the Upper Paraguay basin Pa is about 1,280 mm, and the mean annual runoff coefficient is Kr = 0.08 (Section 3.3.4). Therefore, the mean annual runoff is:
| Ra = Kr Pa = (0.08) (1,280 mm) = 102.4 mm | (4.13) |
|
| Fig. A27 Variation of albedo with color and texture of the Earth's surface. |
The scenario in which increases in albedo and associated climatic changes may take place is the following:
Increases in mean annual runoff coefficient (i.e., water yield) will cause decreases in surface water storage (lakes and baías) and subsurface water storage (soil moisture), leading to decreases in vaporization coefficient (the ratio of evaporation to rainfall).
Decreases in vaporization coefficient will reduce actual evapotranspiration, eventually leading to changes in vegetative species composition, i.e., to the progressive replace ment of hygrophytes by mesophytes in lower ground (adjoining riparian areas), and mesophytes by xerophytes in higher ground (the interfluves).
Increases in xerophytes will decrease vegetative density and cover, increasing the size and frequency of patches of bare ground.
Increasing size and frequency of patches of bare ground will increase the mean albedo, reflecting more radiant energy to the atmosphere and reducing the energy available for productive processes (photosynthesis and evapotranspiration).
The relation between surface albedo and climate is well known in the literature of climatology and meteorology. An extremely productive biome such as the tropical Amazon rainforest has albedos in the range 0.14-0.21 (Gutman, 1994), while a hyperarid desert such as the Sahara has an albedo of 0.5 (Courel et al., 1984). While the albedo of water surfaces is 0.03-0.10, that of sand dunes is 0.3-0.6 (Sumner, 1988).
Charney et al. (1975) reasoned that a decrease in plant cover is usually accompanied by an increase in albedo. This leads to a decrease in the absorbed radiation and an increase in the radiative cooling of the air. Thus, the air would sink to maintain thermal equilibrium, and cumulus convection and associated rainfall would be suppressed. The reduced rainfall would in turn have an adverse effect on plants and would tend to enhance the original decrease in plant cover (Charney et al., 1977).
For arid and semiarid regions, Sud and Molod (1988) have confirmed that the overall effect of high surface albedo is that of cooling inside the planetary boundary layer (PBL). This induces sinking aloft and moisture divergence near the surface, both of which suppress moisture convection and rainfall. Therefore, in a desert border region, such as in the limit between subhumid and semiarid, an increase in surface albedo would be expected to reduce the convective rainfall locally.
Garratt (1993) has recently summarized the response of global climate simulations to changes in albedo. Results of eleven studies showed that an increase in albedo causes:
Decreased land evaporation,
Decreased land precipitation, and
Increased precipita tion over the seas (in the global change cases).
These and other similar studies have shown conclusively that increases in albedo cause climatic changes in the direction of greater aridity, resulting in decreased precipitation, decreased runoff, and increased sediment yield (the latter as in the Pantanal, where the climatic change would be from dry subhumid to semiarid).
Are changes in the runoff regime of the Upper Paraguay river, attributable to the Hidrovia project, likely to lead to substantial changes in mean albedo? The answer to this question is affirmative, although the timeframe for these changes is not readily discernible without further analysis. If the Hidrovia project increases in the short-term the runoff coefficient of the Upper Paraguay river, it will trigger a series of chain reactions to include:
|
Climatic changes are natural processes normally measurable in a geologic timescale. The Upper Paraguay basin itself has been through several climatic changes, e.g., from semiarid in the Jurassic to humid in the Cretaceous (Section 3.2). The great depth of the Quaternary deposits (420 m at Fazenda São Bento, in the Taquari alluvial fan), can only be explained by an active geodynamical process associated with a semiarid climate prevailing in the geologic past. The point to be made is not climatic change, which is always present, but rather, the rate of climatic change. It is now widely believed that anthropogenic climatic change is possible, and that it can occur within decades, rather than millennia.
4.4.2 Impact on the Nutrient Balance
The close relationship between hydrologic and nutrient budgets has been known for some time. For instance, Likens and Bormann (1975) studied the Hubbard Brook Experimental Forest in New Hampshire. Deforestation increased surface runoff and resulted in large increases in streamwater concentration for all major ions (Ca++, K+, NO3-), excepting a few (NH4+ and SO42-). The annual overall loss of phosphorus was about an order of magnitude greater as a result of deforestation. Total export of dissolved substances, exclusive of dissolved organic matter, averaged 81 ton/ha-yr for the deforested catchment, compared to 13 ton/ha-yr for the undisturbed control catchment. The nitrate concentration in the runoff water almost continuously exceeded, and at times, almost doubled, the maximum concentration recommended for drinking water.
Likens and Bormann (1975) cautioned that unless such ecological interrelationships are better understood, human interventions in natural ecosystems can produce unexpected and potentially deleterious results. In a similar study, Elwood and Henderson (1975) emphasized the need for baseline studies of hydrologic and nutrient budgets prior to project implementation or land management decisions.
An example of the relation between hydrologic and nutrient cycles in the Pantanal is given by Silva (1990), who noted that the concentrations of calcium, potassium, and magnesium in the watercourses of the Pantanal of Barão de Melgaço, near Cuiabá (Fig. 2), are greater during flood (cheia) that during low flow (estiagem).
The Pantanal exists because its geologic/geomorphologic setting conditions it to retain water, soil moisture, sediment, and nutrients (Tricart, 1982; Junk, 1989). The extensive and long inundation patterns and the retained soil moisture lower the mean albedo, favoring locally generated rainfall (Stidd, 1975; Balek, 1983). Soil moisture typically lowers mean albedos by a factor of two (Dickinson, 1983). The sediment and associated nutrients imported from upland subbasins tend to remain in the Pantanal, assuring a constant source for replenishment (Carvalho, 1984; Silva, 1990). The retained water sustains the evapotranspiration needs of the vegetation, the sediments continue the valley buildup, and the nutrients are largely filtered out and taken up by the vegetation.
A characteristic feature of the Pantanal ecosystems is the annual flood pulse (Junk et al., 1989). Modifications in the annual flood pulse will lead to changes in the Pantanal, both biotic and abiotic (Sparks, 1995). Wildlife breeding cycles are closely linked to the annual flooding and receding cycle (Bayley, 1995; Campos, 1993). Increases in flood magnitude will result, in the short term, in an increase in sediment yield and a change in the basin's nutrient budget. Loss of nutrients to runoff will mean less biotic productivity and the eventual loss of the Pantanal ecosystems' character as savanna woodlands, where both wildlife and domesticated animal species can coexist.
The most important economic activity in the Pantanal is the raising of cattle. Antunes (1986) has estimated the number of cattle at 3.5 million. On the other hand, Alho et al. (1988) have stated that the seasonal grasslands have fed up to 8 million head of cattle. For centuries, low-density cattle raising has been the predominant land-use activity in the Pantanal. Prance and Schaller (1982) have stated that the natural vegetation of the Pantanal can be maintained together with the ranches, provided that the cattle population is kept within reasonable limits, and that areas are set aside for the conservation of flora and fauna.
The environmental impact of cattle ranching in the Pantanal appears to have been minimal (Alho et al., 1988). Overgrazing, an insidious problem which plagues semiarid and subhumid exorheic basins in other parts of the world, is not a serious problem in the Pantanal. The flood pulse serves the dual purpose of effectively controlling overgrazing, by temporarily impeding grazing in flooded areas, while replenishing the soil with fresh nutrients attached to the fine sediments (Silva, 1990). More importantly, the flood pulse is instrumental in maintaining the grasslands, since competing vegetation types, particularly the woody species, are not well adapted to the flood pulse (Cole, 1960).
Antunes (1986) has pointed out that during the drought of 1965-73, cattle ranching expanded in the Pantanal, as many areas that had previously been seasonally flooded remained nonflooded for more than one season. Beginning in 1974, the flood period returned with an unusual force. This led to the overgrazing of the remaining campos by the suddenly spatially constrained herds. To compound the problem, the campos were already threathened by the invasion of woody species which had taken advantage of the long drought to establish themselves on the dry campos. Similar examples of the invasion by woody species of areas of Pantanal that have been artificially protected from flooding by the use of polders have been reported (H. Benito, personal communication, 1995).
The inundation patterns of the Pantanal have been recently quantified by Hamilton et al (1995) using remote sensing. During exceptional flood years, up to 100,000 km2 (73 percent) of the Pantanal is simultaneously flooded for at least 30 days, controlling over grazing through inundation while replenishing the land with nutrients. On the other hand, during the dry season in drought years, less than 6,770 km2 (5%) of the Pantanal may be flooded, encouraging overgrazing and virtually eliminating nutrient replenishment by natural means.
In conclusion, the flood pulse is the mechanism that provides the nutrient replenishment, overgrazing control, and grassland maintenance on which the natural biotic productivity of the Pantanal hinges.
4.4.3 Impact on the Biota
Changes in the hydrologic regime of the Upper Paraguay river basin will have a definite impact on the biota. Currently, there is a delicate balance between the various types of vegetation, reflecting the predominance of an average tropical climate, with a clear summer rainy season lasting 7 to 9.5 months. Changes in hydrologic signature in the direction of greater aridity will increase the competitiveness of the semiarid scrub forest (caatinga) in higher ground, and lead to reductions in savanna woodland species (cerrados), which currently dominate in the Pantanal (Prance and Schaller, 1982).
The interaction between hydrology and geomorphology is the basis of the biotic makeup of the Pantanal, with the flood pulse being the cornerstone of ecosystem function (Junk et al., 1989). Unlike woody species, herbaceous species are well adapted to the flood pulse, since they are able to tolerate extreme alternations of saturation (flooding lasting from one to three months) and desiccation (dry season lasting 2.5 to 5 months) (Cole, 1960). Thus, changes in hydrologic regime resulting in decreased flood periods and increased drought periods will produce changes in vegetation species composition from herbaceous to woody (Veloso, 1972). This will change the character of the Pantanal ecosystems, from savanna woodlands (with sparsely distributed islands of cerradão) to more mesic forests, reflecting a predominance of the woody over the herbaceous vegetation. In turn, this will produce a change in animal species and populations, wherein those species better adapted to the cerrado will predominate over those adapted to the campos. The decreasing areal coverage of grasslands will have an impact on the cattle ranching industry, which will not be able to support as many animal units as it currently does. In addition, the human use of fire for the control of woody vegetation is likely to increase, negatively impacting air quality.
Thus, the spiral of environmental degradation begins with changes in the hydrology (changes in flood, baseflow, yield, and drought regimes), and eventually has impacts on the biota, both vegetative and animal, including the human species.
4.5 Summary
This section describes the possible hydrologic impacts of the Hidrovia project on the Pantanal of Mato Grosso. The evaluation considers impacts on the water, sediment, and nutrient balance as a direct and indirect consequence of proposed navigational improvements, to include channel straightening, dredging, and blasting of rock outcrops. The following is a summary of the main points established in this section:
-
The Upper Paraguay river upstream of Porto São Francisco (located 146
km upstream of Corumbá) is incapable, without extensive artificial
channel deepening, of accommodating ocean-going vessels (with a 3-m draft
requirement) throughout the year. The extension of the proposed 3-m navigation
channel all the way to Cáceres will require major interventions in the natural channel.
-
Currently, a 1.2 m minimum depth is maintained by autodredging, except in the
places where rock outcrops do not permit autodredging to take place. The Pantanal
exists largely because of these rock outcrops, which act as natural dams, influencing
the regional flow patterns in at least three places: Amolar, Porto da Manga, and
Fecho dos Morros.
-
Blasting rocky sills as a means of deepening the navigational channel will
have an irreversible impact on the hydrologic regime of the Upper
Paraguay river, particularly upstream of Corumbá. In essence, the blasting
amounts to natural dam removal, which will increase runoff and
accelerate runoff concentration, intensifying floods.
-
Relatively minor changes in grade, which would necessarily take place as
a result of blasting rocky sills, can affect the upstream hydraulics to
greater lengths than may have been anticipated. For instance, the backwater
effect produced by a 0.47-m hump in the bed profile at Amolar may be felt for a
distance of 375 km upstream.
-
Unlike a typical alluvial river, the longitudinal profile of the Upper Paraguay river is
convex when observed from above, revealing the presence of substantial geologic
controls. A rock outcrop has been documented along the Upper Paraguay river
every 40 km on the average (Fig. A28).
-
It is expected that the removal of rocky sills may lead to the appearance
of other rocky sills, which were previously submerged. This will open up
a spiral of environmental degradation, in the form of loss of water,
sediment, and nutrients, and produce ecological changes which would be
extremely difficult to control.
-
Channel modifications (straightening, dredging, and particularly blasting of rocky
sills), will destabilize the river's baseflow regime, and will demand future
action in the river to continue to maintain the required minimum draft for
navigation, i.e., it will set in place a vicious circle of channel interventions.
-
The Hidrovia project will, in the short term, increase the mean annual runoff
coefficient above its current value (0.08), reducing evapotranspiration amounts and
negatively affecting the vegetative biota.
-
The acceleration of runoff concentration caused by navigational improvements will
intensify high mean, extraordinary and exceptional floods, potentially reduce the
recurrence interval of multiannual drought periods, and may lead in the long term to
climatic changes in the direction of greater aridity.
-
Runoff losses will greatly increase sediment and nutrient losses,
destabilizing the Pantanal ecosystems by modifying the nutrient budget, resulting
in reduced biotic productivity.
-
Long-term changes in the hydrologic regime of the Upper Paraguay river in the
direction of greater aridity (lesser precipitation, lesser evaporation/evapotranspiration, and
lesser runoff amounts) will have a definite impact on the biota. The competitiveness
of the semiarid scrub forest (caatinga) will increase, adversely affecting the delicate
balance between the diverse plant communities that inhabit the Pantanal.
- Modifications in the flood pulse, coupled with long-term climatic changes in the direction of greater aridity, will produce an ecological succession from herbaceous to woody species. The size and number of vegetated earth mounds (capões) will increase, with the grasslands (campos) expected to be the net losers. Both wildlife and domesticated animal species will be adversely affected.
|
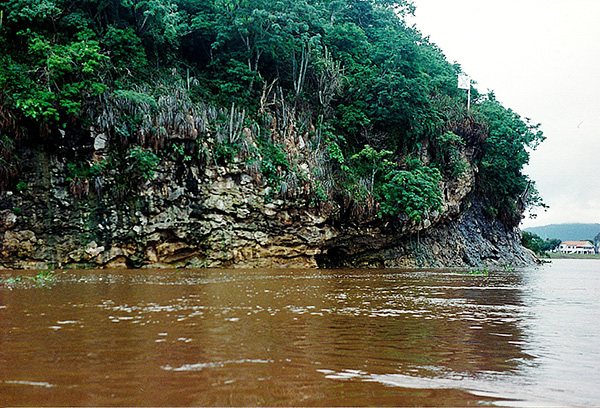
| Fig. A28 Typical rock outcrop along the Paraguay river. |
5. SUMMARY
|
|
This last section summarizes the findings of this study. It is divided into three subsections:
The Pantanal of Mato Grosso
The Hidrovia Project
The Hydrologic and Environmental Impacts.
Each subsection summarizes the main points established in this study. Additional details can be found in the respective sections of this report: the Pantanal of Mato Grosso, subsection 2.3 and Section 3; the Hidrovia Project, subsection 2.4; and Hydrologic and Environmental Impacts, Section 4. A subsection entitled "Concluding Remarks" ends this section of the report.
5.1 The Pantanal of Mato Grosso
The following points were established during the course of this study:
The Pantanal of Mato Grosso is a seasonally inundated depression wholly contained within the Upper Paraguay river basin, encompassing 136,700 km2 in Mato Grosso and Mato Grosso do Sul, Central Western Brazil. The Pantanal is an immense and biologically diverse wetland, geomorphologically and hydrologically positioned to attenuate and reduce the runoff from the Upper Paraguay basin.
The predominantly Upper Precambrian formations underlie extensive Quaternary deposits, with significant rock outcrops. Geomorphologic evidence reveals the presence of a substantial amount of tectonic activity in the form of subsidence and uplift.
The bed of the Upper Paraguay river is controlled by the prevailing geology. The longitudinal profile of the river is convex when observed from above, revealing the presence of substantial geologic controls. There are thirty-two (32) documented rock outcrops within 1,270 km of river, an average of one every 40 km.
The abnormally low runoff coefficient of the Upper Paraguay river at its mouth (a value of 0.08) is a direct result of its hydrologic interaction with the Pantanal. The latter functions as an immense surface/subsurface reservoir which stores water in both annual and multiannual timeframes.
The Upper Paraguay river is very effective in decreasing the flood peaks and correspondingly increasing the low flows. The presence of the Pantanal provides the mechanism for the diffusion of flood flows and the increased permanence of low flows.
The hydrographic records at Ladario show the extremely strong attenuating capacity of the Pantanal upstream of this point. Throughout the entire period of record (1900-95), the flood wave at Ladario has always been unimodal (only one rise and one recession per year).
The Pantanal functions not only as an attenuating mechanism for flood flows, but also as an abstracting mechanism for all flows, i.e., as an effective means of storing the would-be runoff and converting it instead to evaporation and evapotranspiration. Throughout millennia, this process has been responsible for sustaining the extraordinary biotic potential of the Pantanal.
The Pantanal is still a surface of sediment accumulation, with a net annual gain of sediment and nutrients.
The Pantanal is extremely rich in floristic diversity and physiognomic composition. Its floristic diversity is due to its privileged location, surrounded by four great South American biomes: the tropical Amazon rainforest, the subhumid savannas of Central Brazil, the Atlantic humid forest, and the semiarid scrub forest of the Chaco. Its diverse physiognomic composition is due to its variety of geomorphic/topographic features.
The Pantanal remains a unique repository for a variety of wildlife species, including numerous species of birds, fish, reptiles, and mammals. Many species selectively inhabit the campos, vegetated earthmounds (capões, cordilheiras), gallery forests, and water courses (baías, corixos, vazantes) of the Pantanal. Such impressive biodiversity is due in large measure to the unique geologic, geomorphologic, and hydrologic setting of the Pantanal.
5.2 The Hidrovia Project
The following points were established during the course of this study:
The Paraná-Paraguay river system has been used as a waterway for transportation for several centuries. The river system encompasses the Upper, Middle, and Lower Paraguay rivers, and the Middle and Lower Parana rivers. It drains portions of Brazil, Paraguay, Bolivia, and Argentina.
The Paraná-Paraguay Waterway Project, known locally as the Hidrovia Paraná-Paraguay, for short, Hidrovia, is currently being considered for funding by the Inter-American Development Bank.
The executive agency for the Hidrovia project is the Comité Intergubernamental de la Hidrovía (CIH), an intergovernmental agency set up by the governments of the five countries which have jurisdiction in the waterway: Argentina, Bolivia, Brazil, Paraguay, and Uruguay.
The Hidrovia project entails navigational improvements along the existing Paraná-Paraguay Waterway. The project considers extensive river engineering works, including channel straightening, dredging, blasting of rocky sills, and other structural interventions to render 3442 km of the river navigable for ocean-going vessels, from the downstream point at Nueva Palmira, Uruguay, to the upstream point at Cáceres, Mato Grosso, Brazil, near the headwaters of the Upper Paraguay river.
Since the port of Cáceres is located upstream of the Pantanal of Mato Grosso, it is expected that the Hidrovia project, if implemented as currently envisioned, will threaten the Pantanal's preeminent status as the largest remaining wetland in the American continent and the world.
In February 1995, the Inter-American Development Bank and the United Nations Development Programme commissioned engineering and environmental impact studies of the proposed project. These studies are ongoing, with results expected in late 1996.
To this date, the only comprehensive document on the Hidrovia project is the INTERNAVE report, completed in 1990 by the Brazilian company Internave. This report is essentially an economic feasibility study of the Hidrovia project.
The physical aspects of the proposed Hidrovia (channel straightening, dredging, and blasting of rocky sills) are the source of significant concern among diverse segments of the national and international communities, including indigenous peoples, environmental organizations, nongovernmental organizations (NGOs), professional associations, and universities in Brazil, the American continent, and the rest of the world. The concern is that the Hidrovia project may cause irreparable harm to the Pantanal wetlands, a significant focus of biodiversity in the American continent.
5.3 The Hydrologic and Environmental Impacts
The following points were established during the course of this study:
The proposed navigational improvements (channel straightening, dredging, and blasting of rocky sills) will have a substantial impact on the flood regime of the Upper Paraguay river. The degree of the impact will vary depending on the type and extent of intervention, and its location along the river.
During high mean (2-yr), extraordinary (4-yr), and exceptional (10-yr) floods, channel straightening will accelerate the concentration of flood runoff and increase the flood wave peak at Ladario.
The Upper Paraguay river upstream of Porto São Francisco (located 146 km upstream of Corumbá) is incapable, without extensive artificial channel deepening, of accommodating ocean-going vessels (with a 3-m draft requirement) throughout the year. The planned extension of a 3-m navigation channel all the way to Cáceres will require major interventions in the natural channel.
The Upper Paraguay river is subject to the "autodredging" phenomenon. By adjusting the shape and configuration of its bedforms, the river is able, during low flows to reduce its discharge while maintaining an approximately constant stage (and minimum flow depth). In the Upper Paraguay river, this minimum depth is 1.2 m, except where rock outcrops do not permit autodredging to take place. To the extent that this minimum depth is violated in many places, it is concluded that the slope of the Upper Paraguay river is geologically controlled.
Blasting rocky sills as a means of deepening the navigation channel will have an irreversible impact on the hydrology of the Upper Paraguay river. This is the most significant planned intervention. If pursued, it is likely to change the Pantanal forever.
Navigation charts shows that the river has been able to carve a sufficiently deep channel through most of the rock outcrops. Yet, in other places, where the depth is shallower because rocky sills protrude into the channel, the river has not yet carved an opening. The Pantanal exists because of these rocky sills, which influence the regional flow patterns in Amolar, Porto da Manga, and Fecho dos Morros.
Backwater calculations confirm that relatively minor changes in grade, which would necessarily take place as a result of blasting rocky sills, can affect the upstream hydraulics to greater lengths than may have been anticipated. The rocky sills act as natural dams; if they are removed, extensive areas of the Pantanal will no longer be subject to seasonal flooding.
Removal of one rocky sill may lead to the appearance of another rocky sill which was previously submerged. This is a distinct possibility in the Upper Paraguay river, where rock outcrops have been documented to occur every 40 km on the average, and where the prevailing channel slopes are so mild that the backwater effect of a 0.5-m obstruction or hump may be felt for about 400 km upstream.
It is expected that channel modifications will destabilize the river's baseflow regime and will demand additional future interventions in the river to continue to maintain the required minimum draft, i.e., it will set in place a vicious circle of channel interventions.
The acceleration of runoff concentration caused by navigational channel improvements will intensify high mean, extraordinary and exceptional floods, potentially reduce the recurrence interval of drought periods, and may eventually lead to regional climatic changes in the direction of greater aridity.
Extraordinary and exceptional flood peaks on the Upper Paraguay river will be felt earlier downstream, at Asunción, on the Middle Paraguay, and at Corrientes, on the Middle Paraná. The precise extent of this effect remains to be determined by further analysis.
Changes in the runoff regime of the Upper Paraguay river are likely to lead to substantial increases in mean albedo. In other parts of the world, the evidence (circumstantial and experimental) is mounting linking increases in mean albedo to climatic changes in the direction of greater aridity. The Pantanal is not immune to climatic changes, which have occurred in the geologic past; the point to be made is the rate of climatic change. It is now widely believed that anthropogenic climatic change is possible and that it can occur in decades, rather than millennia.
The Pantanal exists because its climatic/geologic/geomorphologic setting conditions it to retain water, sediment, and nutrients. Modifications in the annual flood pulse will lead to changes in the Pantanal, both biotic and abiotic. Increases in flood magnitude will result in increased sediment and nutrient losses.
The annual flooding of extensive areas of Pantanal serves the dual purpose of effectively controlling overgrazing and replenishing the soil with fresh nutrients. More importantly, the seasonal flood pulse is instrumental in maintaining the grasslands, since competing vegetation types, particularly the woody species, are not well adapted to the extreme alternations of saturation and desiccation.
Changes in hydrologic regime resulting in increased floods and droughts will impair nutrient replenishment and lead to reductions in biotic productivity. These changes will produce a succession from herbaceous to woody species, which will change the dominant character of the Pantanal from savanna woodlands to more mesic forests. The open grasslands will shrink, and this will have a negative impact on cattle ranching.
5.4 Concluding Remarks
The Hidrovia project is expected to have a significant hydrologic and environmental impact on the Upper Paraguay river and the adjoining Pantanal of Mato Grosso. The latter is a unique terrestrial region where an unusual combination of continental location, climate, geology, geomorphology, and surface and groundwater hydrology has contributed, through millennia, to the establishment of a delicate ecological balance. Throughout the past two centuries of human settlement, the environmental impact of cattle ranching, considered to be the most important economic activity in the Pantanal, appears to have been minimal.
In essence, the Hidrovia project seeks to convert a portion of the water resources, from the maintenance of an environment suited to low-density cattle ranching and diverse wildlife habitats, to the maintenance of an inland waterway for the transportation of goods, primarily for export. For this purpose, the project proposes to carve a channel, sufficiently straight and deep to be suited for ocean-going vessels, all the way to Cáceres, upstream of the Pantanal.
The Upper Paraguay river, from its mouth at the Apa river confluence to the city of Corumbá (a distance of 590 km upstream), is generally straight and deep enough for the passage of large vessels, excluding a few locations where some dredging may be required if the navigation project is implemented up to Corumbá. However, upstream of Corumbá, toward Cáceres (a distance of 680 km), the river is too shallow and in some places too sinuous to effectively function as a commercial year-round waterway. This is why current commercial river traffic between Corumbá and Cáceres is almost nonexistent. The artificial straightening and deepening of the Upper Paraguay river all the way to Cáceres will provide a navigation channel, but at the cost of substantial losses of water, sediment, and nutrients.
How these losses will compare with the project gains (expected reductions in transportation costs) is a question that deserves a clear and definitive answer prior to project implementation. This is particularly crucial in the case of the Pantanal, where irreversible interventions in the natural channel (the blasting of rocky sills) have the potential to destabilize the hydrologic regime. The Pantanal ecosystems are extremely complex, and their myriad of biotic/abiotic interrelations are only now being thoroughly examined (Prado et al., 1994; Heckman, 1994; and others). Unless all costs are effectively incorporated into the economic analysis, the prudent course of action is to preserve the Pantanal's preeminent status as the largest and most biologically diverse wetland of the Americas and the world.
REFERENCES
|
|
Ab'Sáber, A. N. 1988. O Pantanal Matogrossense e a teoria dos refúgios. Revista Brasileira de Geografia, 50, n. especial, t. 2, 9-57, Rio de Janeiro, Brazil.
Adámoli, J. A. 1981. O Pantanal e suas relações fitogeográficas com os cerrados. Discussão sobre o conceito "Complexo do Pantanal." In Congresso Nacional de Bot�nica, Teresina, Piauí, Anais da Sociedade Brasileira de Bot�nica, 32, 109-119.
Adámoli, J. A. 1986a. A dinámica das inundações no Pantanal. Anais do 1o Simpósio sobre Recursos Naturais e Socio-económicos do Pantanal, Corumbá, MS, 28 Novembro a 4 de Dezembro, 51-61.
Adámoli, J. A. 1986b. Fitogeografia do Pantanal. Anais do 1o Simpósio sobre Recursos Naturais e Socio-económicos do Pantanal, Corumbá, MS, 28 Novembro a 4 de Dezembro, 1984, 105-106.
Alfonsi, R. R., and M. B. P. de Camargo. 1986. Condições climáticas para a região do Pantanal Matogrossense. Anais do 1o Simpósio sobre Recursos Naturais e Socio- económicos do Pantanal, Corumbá, MS, 28 Novembro a 4 de Dezembro, 1984, 29-43.
Alho, C. J. R. 1986. Manejo da fauna silvestre. Anais do 1o Simpósio sobre Recursos Naturais e Socio-económicos do Pantanal, Corumbá, MS, 28 Novembro a 4 de Dezembro, 1984, 183-197.
Alho, C. J. R., T. E. Lacher, Jr., and H. C. Gonçalves. 1988. Environmental degradation in the Pantanal ecosystem. BioScience, 38(3), 164-171.
Almeida, F. F. M. 1945. Geologia do Sudoeste Matogrossense. Boletim No. 116, Departamento Nacional da Produção Mineral, Rio de Janeiro, Brazil.
Amaral Filho, Z. P. 1986. Solos do Pantanal Matogrossense. Anais do 1o Simpósio sobre Recursos Naturais e Sócio-econômicos do Pantanal, Corumbá, MS, 28 Novembro a 4 de Dezembro, 91-103.
Anderson Jr., R. J., N. da F. R. dos Anjos, and H. F. Diaz. 1993. An analysis of flooding in the Paraná/Paraguay river basin. LATEN Dissemination Note # 5, The World Bank, Latin America Technical Department, Environment Division, September.
Antas, P. T. Z. 1983. Migration of nearctic shorebird (Charadriidae and Scolopacidae) in Brazil - Flyways and their different seasonal use. Wader Study Group Bulletin, 39(83), 53-56.
Antunes, M. P. 1986. Plano de desenvolvimento integrado da Bacia do Alto Paraguai, EDIBAP, Programação Agropecuaria. Anais do 1o Simpósio sobre Recursos Naturais e Sócio-econômicos do Pantanal, Corumbá, MS, 28 Novembro a 4 de Dezembro, 1984, 237-255.
Balek, J. 1983. Hydrology and water resources in tropical regions. Developments in Water Science, No. 18, Elsevier, Amsterdam.
Bayley, P. B. 1995. Understanding large river-floodplain ecosystems. BioScience, 45(3), 153-158.
Berner, E. K., and R. A. Berner. 1987. The global water cycle: Geochemistry and environment. Prentice-Hall, Inc.
Blench, T. 1986. Mechanics of plains rivers. Printing Services, University of Alberta, Edmonton, Alberta, Canada.
Bonetto, A. A. 1975. Hydrologic regime of the Paraná river and its influence on ecosystems. In Coupling of Land and Water Systems, edited by A. D. Hasler, Springer-Verlag, New York, 175-197.
Brazilian Constitution, 1988. Reference to the preservation of the Pantanal and other Brazilian biomes: Chapter 5, Article 225, paragraph 4.
Brown Jr., K. S. 1986. Zoogeografía da região do Pantanal Mato-Grossense. Anais do 1o Simpósio sobre Recursos Naturais e Sócio-econômicos do Pantanal, Corumbá, MS, 28 Novembro a 4 de Dezembro, 1984, 137-178.
Bucher, E. H., A. A. Bonetto, T. P. Boyle, P. Canevari, G. Castro, P. Huszar, and T. Stone. 1993. Hidrovia: An initial environmental examination of the Paraná-Paraguay Waterway. Wetlands for the Americas (Humedales para las Americas), Publication No. 10, Manomet, Mass., USA, and Buenos Aires, Argentina.
Bull, W. B. 1991. Geomorphic response to climatic change. Oxford University Press, New York.
Campos, Z. 1993. Effect of habit on survival of eggs and sex ratio of hatchlings of Caiman crocodilus yacare in the Pantanal, Brazil. J. Herpetology, 27(2), 127-132.
CEBRAC/ICV/WWF. 1994. Hidrovía Paraguai-Paraná: Quem paga a conta? Fundação Centro Brasileiro de Referência e Apoio Cultural, Instituto Centro de Vida, and World Wildlife Fund, Brasilia, Brazil, September.
Carvalho, N. de O. 1986. Hidrologia da bacia do Alto Paraguai. Anais do 1o Simpósio sobre Recursos Naturais e Sócio-econômicos do Pantanal, Corumbá, MS, 28 Novembro a 4 de Dezembro, 1984, 43-49.
Charney, J., P. H. Stone, and W. J. Quirk. 1975. Drought in the Sahara: A biophysical feedback mechanism. Science, 187, 434-435.
Charney, J., W. J. Quirk, S-H. Chow, and J. Kornfeld. 1977. A comparative study of the effects of albedo change on drought conditions in semiarid regions. J. Atmospheric Sciences, 36, 1366-1385.
Chow, V. T. 1959. Open-channel hydraulics. Mc-Graw Hill, New York.
Christofoletti, A. 1981. Geomorfologia fluvial. Volume 1: O Canal Fluvial. Editora Edgard Blucher Ltda., São Paulo, Brazil.
Cintra, R., and C. Yamashita. 1990. Habitats, abund�ncia e ocorrência das espécies de aves do Pantanal de Poconé, Mato Grosso, Brasil. Papéis Avulsos de Zoologia, Museu de Zoologia de Universidade de São Paulo, 37(1), 1-21.
Colby, B. R. 1964. Discharge of sands and mean velocity relations in sand-bed streams. U.S. Geological Survey Professional Paper 462-A, Washington, D.C.
Cole, M. M. 1960. Cerrado, caatinga, and pantanal: The distribution and origin of the savanna vegetation of Brazil. Geographical Journal, 126, 168-179.
Courel, M. F., R. S. Kandel, and S. I. Rasool. 1984. Surface albedo and the Sahel drought. Nature, 307, 528-531.
Cunha, C. N. da 1990. Estudos florísticos e fitofisionómicos das principais formações arbóreas do Pantanal do Poconé-MT, Master's thesis, Universidade Estadual de Campinas, São Paulo, Brazil.
Dendy, F. E., and G. C. Bolton. 1976. Sediment yield-runoff-drainage area relationships in the United States. J. Soil and Water Conservation, 31(6), November-December, 264-266.
Dickinson, R. E. 1983. Land surface processes and climate-surface albedos and energy balance. Advances in Geophysics, 25, 305-353, Academic Press.
DNOS. 1974. Estudos hidrológicos da bacia do Alto Paraguai. Departamento Nacional de Obras de Saneamento, Ministerio do Interior, Brazil, in 4 volumes.
Dorr, J. van N. 1945. Manganese and iron deposits of Morro do Urucum, Mato Grosso, Brazil. Bulletin 946-A, U.S. Geological Survey, U.S. Dept. of Interior, Wash., D.C.
Dourojeanni, M. J. 1980. Desarrollo y conservación en el Pantanal Matogrossense (Brasil), con especial referencia al manejo de la fauna silvestre. Report, Instituto Brasileiro de Desenvolvimento Florestal, Projeto PNUD/FAO BRA/78/003, Brasilia, Brazil.
EDIBAP. 1979. Estudo de desenvolvimento integrado da bacia do Alto Paraguai. Relatorio da 1a Fase, Superintendência do Desenvolvimento da Região Centro Oeste (SUDECO), Ministerio do Interior, Brasilia, Brazil, in cooperation with the Organization of American States (OAS), in 4 volumes.
EMBRAPA. 1986. Anais do 1o Simpósio sobre Recursos Naturais e Sócio- econômicos do Pantanal, Corumbá, MS, 28 Novembro a 4 de Dezembro, 1984, Empresa Brasileira de Pesquisa Agropecuaria, Brasilia, 265 p.
Eiten, G. 1975. The vegetation of the Serra do Roncador. Biotropica, 7, 112-135.
Elwood, J. W., and G. S. Henderson. 1975. Hydrologic and chemical budgets at Oak Ridge, Tennessee. In Coupling of Land and Water Systems, edited by A. D. Hasler, Springer-Verlag, New York, 31-51.
Freitas, R. O. de. 1951. Ensaio sôbre o relêvo tectônico do Brasil. Revista Brasileira de Geografia, Abril-Junho, XIII, No. 2.
Furley, P. A., and J. A. Ratter. 1988. Soil resources and plant communities of the Central Brazilian cerrado and their development. J. Biogeography, 15, 97-108.
Garratt, J. R. 1993. Sensitivity of climate simulations to land-surface and atmospheric boundary-layer treatments--A review. J. Climate, 6, 419-449.
Godoi Filho, J. D. de. 1986. Aspectos geológicos do Pantanal Mato-Grossense e de sua área de influencia. Anais do 1o Simpósio sobre Recursos Naturais e Sócio- econômicos do Pantanal, Corumbá, MS, 28 Novembro a 4 de Dezembro, 1984, 63-90.
Guerra, P. de B. 1981. A civilização da seca. Departamento Nacional de Obras Contra Secas (DNOCS), Fortaleza, Ceará, Brazil.
Gutman, G. G. 1994. Global data on land surface parameters from NOAA AVHRR for use in numerical climate models. J. Climate, 7, 669-680.
Hamilton, S. K., S. J. Sippel, and J. M. Melack. 1995. Inundation patterns in the Pantanal wetland of South America determined from passive microwave remote sensing. Unpublished manuscript; in review for possible publication in Water Resources Research.
Heckman, C. W. 1994. New limnological nomenclature to describe ecosystem structure in the tropical wet-and-dry climatic zone. Arch. Hydrobiol., 130(4), 385-407, June, Stuttgart, Germany.
Hoehne, F. C. 1936. O grande Pantanal de Mato Grosso. Boletim Agricola São Paulo, 1936, 443-470.
Hydrotechnic Corporation. 1979. Reservoir regulation study: Headwaters subbasins and Pantanal basin. Integrated Development Study of the Upper Paraguay River Basin (EDIBAP), report prepared for the Organization of American States, Washington, D. C.
IDB. 1995. Anexo Ib (Módulo B-1): Términos de referencia para los estudios de ingeniería y factibilidad económica de la Hidrovía Paraguay-Paraná (Puerto Cáceres- Puerto de Nueva Palmira), y se�alización desde Corumbá a Puerto Cáceres. Banco Interamericano de Desarrollo, Washington, D.C.
International Rivers Network. 1995. Hidrovia Campaign, Dossier 1, March 1995. Berkeley, California.
INTERNAVE. 1990. Hidrovia Paraguai-Paraná, Estudo de viabilidade econômica, Relatorio final. Internave Engenharia, São Paulo, Brazil, February.
Jansen, P. Ph., L. van Bendegom, J. van den Berg, M. de Vries, and A. Zanen. 1982. Principles of river engineering: The nontidal alluvial river. Pitman, London.
Junk, W. J., P. B. Bailey, and R. E. Sparks. 1989. The flood-pulse concept in river-floodplain systems. Proceedings of the International Large River Symposium, Canadian Special Publication Fishing and Aquatic Sciences 106, 110-117.
Lammers, O., D. Moore, and K. Treakle. 1994. Considering the Hidrovia: A preliminary report on the status of the proposed Paraguay/Paraná waterway project. International Rivers Network, Working Paper No. 3, June.
Lane, E. W. 1955. The importance of fluvial morphology in hydraulic engineering. Proceedings of the American Society of Civil Engineers, Hydraulics Division, 81, paper 745.
Langbein, W. B., and S. A. Schumm. 1958. Yield of sediment in relation to mean annual precipitation. Transactions, American Geophysical Union, 39(6), 1076- 1084.
Leopold, L. B., M. G. Wolman, and J. P. Miller. 1964. Fluvial processes in geomorphology. W. H. Freeman and Company, San Francisco, California.
Leopold, L. B. 1994. A view of the river. Harvard University Press, Cambridge, Massachusetts.
Leverger, A. 1862a. Roteiro da navegação do Rio Paraguay, desde a Foz do Rio Sepotuba até a do Rio São Lourenço. Revista Trimensal do Instituto Histórico, Geográphico, e Ethnográphico do Brasil, II Trimestre de 1862.
Leverger, A. 1862b. Roteiro da navegação do Rio Paraguay, desde a Foz do São Lourenço até o Paraná. Revista Trimensal do Instituto Histórico, Geográphico, e Ethnográphico do Brasil, II Trimestre de 1862.
Likens, G. E., and F. H. Bormann. 1975. An experimental approach to New England landscapes. In Coupling of Land and Water Systems, edited by A. D. Hasler, Springer-Verlag, New York, 7-29.
L'vovich, M. I. 1979. World water resources and their future. American Geophysical Union. Original in Russian, English translation.
Marinha do Brasil. 1974, and subsequent revisions. Croquis de navegação, Rio Paraguay, Cáceres a Corumbá, No. 1-108.
Marinha do Brasil. 1974, and subsequent revisions. Cartas de navegação, Rio Paraguay, Corumbá a Rio Apa, No. 3230 A/B to 3239 A/B.
OEA, 1969. Cuenca del Plata, Estudio para su Planificación y Desarrollo. Secretaría General de la Organización de los Estados Americanos, Washington, D. C.
OEA. 1975. Republica del Paraguay, Proyecto Aquidabán, Desarrollo de la Región Nororiental. Cuenca del Plata, Estudio para su Planificación y Desarrollo. Secretaría General de la Organización de los Estados Americanos, Washington, D. C.
Orellana, M. M. P. 1979. Estudos de viabilidade de controle das cheias e suas consequencias no equilibrio ecológico do Sistema Pantanal. Projeto RADAMBRASIL, Relatorio Interno, Goiania, Goiás, Brazil.
Paiva, M. P. Aproveitamento de recursos faunísticos do Pantanal de Mato Grosso; pesquisas e desenvolvimento de sistemas de produção mais adequados � região. EMBRAPA, Brasilia, 71 p.
Ponce, V. M. 1989. Engineering hydrology: Principles and practices. Prentice Hall, Englewood Cliffs, New Jersey.
Ponce, V. M., and D. S. Lindquist. 1990. Management of baseflow augmentation: A review. Water Resources Bulletin, 26(2), 259-268.
Ponce, V. M., and C. N. da Cunha. 1993. Vegetated earthmounds in tropical savannas of Central Brazil: A Synthesis. J. Biogeography, 20, 219-225.
Ponce, V. M. 1994. Critique of 'An Analysis of Flooding in the Paraná/Paraguay River Basin,' by R. J. Anderson, N. da F. R. dos Anjos, and H. F. Diaz, 1993. Report prepared for the Environmental Defense Fund, Oakland, California.
Ponce, V. M., and A. V. Shetty. 1995a. A conceptual model of catchment water balance. 1. Formulation and calibration. J. Hydrology, 173, 27-40.
Ponce, V. M., and A. V. Shetty. 1995b. A conceptual model of catchment water balance. 2. Application to runoff and baseflow modeling. J. Hydrology, 173, November, 41-50.
Ponce, V. M. 1995. Management of droughts and floods in the semiarid Brazilian Northeast: The case for conservation. J. Soil and Water Conservation, 50(5), 422-431.
PORTOBRAS. 1983. Rio Paraguai: Navegabilidade de Ladário a Assunção. Relatorio Resumo, Empresa de Portos do Brasil, Departamento de Vias Navegáveis, Junho.
Prado, A. L. do., C. W. Heckman, and F. R. Martins. 1994. The seasonal succession of biotic communities in wetlands of the tropical wet-and-dry climatic zone: II. The aquatic macrophyte vegetation in the Pantanal of Mato Grosso, Brazil. Int. Revue ges Hydrobiol., 79(4), 569-589.
Prance, G. T., and G. B. Schaller. 1982. Preliminary study of some vegetation types of the Pantanal, Mato Grosso, Brazil. Brittonia, 34, 228-251.
Projeto Bodoquena. 1979. Geologia das regiões Centro e Oeste de Mato Grosso do Sul--Projeto Bodoquena. Departamento Nacional da Produção Mineral, Brasilia, Brazil.
Projeto RADAMBRASIL. 1982a. Levantamento de recursos naturais. Volume 27: Folha SE.21 Corumbá e parte da Folha SE.20.
Projeto RADAMBRASIL. 1982b. Levantamento de recursos naturais. Volume 28: Folha SF.21 Campo Grande.
Projeto RADAMBRASIL. 1984. Estudo geomorfológico aplicado � bacia do Alto Rio Paraguay e Pantanais Matogrossenses. Projeto RADAMBRASIL, Boletim Técnico, Série Geomorfologia, p. 91-183.
Quigley, H. B., and P. G. Crawshaw, Jr. 1992. A conservation plan for the jaguar Pantera onça in the Pantanal region of Brazil. Biological Conservation, 61, 149-157.
Richey, J. E., C. Nobre, and C. Desser. 1989. Amazon river discharge and climate variability: 1903 to 1985. Science, 246, 101-103.
Sánchez, R. O. 1978. Las unidades geomórficas del Pantanal y sus connotaciones biopedoclimáticas. Sétimo Congreso Argentino de la Ciencia del Suelo, Buenos Aires, Argentina.
Schaller, G. B. 1983. Mammals and their biomass on a Brazilian ranch. Arquivos de Zoologia, Museu de Zoologia da Universidade de São Paulo, 31(1), 1-36.
Schumm, S. A. 1977. The fluvial system. John Wiley and Sons, New York.
Silva, T. C. 1986. Contribuição da geomorfologia para o conhecimento e valorização do Pantanal. Anais do 1o Simpósio sobre Recursos Naturais e Sócioeconômicos do Pantanal, Corumbá, MS, 28 Novembro a 4 de Dezembro, 1984, 77-90.
Silva, C. J. da, and V. Pinto-Silva. 1989. Macrófitas aquáticas e as condições físicas e químicas dos "alagados," "corixos," e rios, ao longo da Rodovia Transpantaneira- Pantanal Matogrossense (Poconé-MT). Revista Brasileira de Biologia, 49(3), 691-697.
Silva, C. J. da. 1990. Influencia da variação do nivel d'agua sobre a estrutura e funcionamento de uma área alagável do Pantanal Matogrossense (Pantanal de Barão de Melgaço, Municipio de Santo Antonio de Leverger e Barão de Melgaço - MT). Doctoral Thesis, Department of Biological Sciences, Universidade Federal de São Carlos, São Paulo, Brazil.
Silva, C. J. da., and F. A. Esteves. 1993. Biomass of three macrophytes in the Pantanal of the Mato Grosso, Brazil. International Journal of Ecology and Environmental Sciences, 19, 11-23.
Silva, M. P., G. M. Mourão, R. A. Mauro, M. E. Coutinho, and W. M. Thomas. 1995. Deforestation in the Pantanal wetland of Brazil. Unpublished manucript, in review for possible publication in Biological Conservation.
Sparks, R. E. 1995. Need for ecosystem management of large rivers and their floodplains. BioScience, 45(3), 168-182.
Stidd, C. K. 1975. Irrigation increases rainfall? Science, 188, 279-280.
Sud, Y. C., and A. Molod. 1988. A GCM simulation study of the influence of Saharan evapotranspiration and surface-albedo anomalies on July circulation and rainfall. Monthly Weather Review, 116, 2388-2400.
Sumner, G. 1988. Precipitation: Processes and analysis. J. Wiley and Sons.
Tarifa, J. R. 1986. O sistema climático do Pantanal. Da compreensão do sistema a definição de prioridades de pesquisa climatológica. Anais do 1o Simpósio sobre Recursos Naturais e Sócioeconómicos do Pantanal, Corumbá, MS, 28 Novembro a 4 de Dezembro, 1984, 9-27.
Tricart, J. 1982. El Pantanal: Un ejemplo del impacto de la geomorfología sobre el medio ambiente. Geografía, 7(13-14), 37-50, São Paulo, Brazil.
U.S. Army Engineer North Pacific Division. 1975. Program description and user manual for SSARR model (Streamflow Synthesis and Reservoir Regulation), Program 724-K5-G0010, Portland, Oregon, September, issued 1972, revised 1975.
U.S. Department of Agriculture, 1940. Influences of vegetation and watershed treatment on runoff, silting, and streamflow. Miscellaneous Publication No. 397, Washington, D. C., July.
Valverde, O. 1972. Fundamentos geográficos do planejamento do Municipio de Corumbá, Revista Brasileira de Geografía, Rio de Janeiro, 34(1), 49-144.
Veloso, H. P. 1947. Considerações gerais sobre a vegetação do Estado de Mato Grosso, II. Notas preliminares sobre o pantanal e zonas de transição. Mem. Inst. Oswaldo Cruz, 45, 253-272.
Veloso, H. P. 1972. Aspectos fitoecológicos da Bacia do Alto Paraguai. Biogeografía, 7, 31 p.
|
| Fig. B1 Front cover of the original report. |
| http://ponce.sdsu.edu/hydrologic_and_environmental_impact_of_the_parana_paraguay_waterway.html | 220908 |