|
|
CIVE 445 - ENGINEERING HYDROLOGY
CHAPTER 2B: BASIC HYDROLOGIC PRINCIPLES, HYDROLOGIC ABSTRACTIONS
|
- Hydrologic abstractions important in Engineering Hydrology are the following:
- Interception
- Infiltration
- Surface or depression storage
- Evaporation
- Evapotranspiration
Interception
- Interception is the process by which precipitation is abstracted by vegetation or other forms of surface cover.
- Throughfall is that part of precipitation which reaches the ground after passing through the vegetative cover.
- Interception losses are a function of
- storm character, including intensity, depth and duration;
- type, extent and density of vegetative cover,
- time of the year (season).
- Annual interception losses, primarily from light storms, can amount to 25% of rainfall.
- For heavy storms, interception losses usually amount to a small fraction of total rainfall.
- For flood studies, the neglect of interception is generally justified on practical grounds.
Infiltration
- Infiltration is the process by which precipitation is abstracted by seeping into the soil below the land surface.
- The infiltrated water moves mostly vertically until it reaches the groundwater table (saturation).
- Groundwater flows laterally (along a piezometric gradient) toward zones of lower elevation, and eventually reaches
streams or rivers (baseflow).
- Infiltration is measured in in/hr or mm/hr.
- Rate of infiltration is integrated over the storm duration to obtain the total infiltration (mm or in).
- Average rate is obtained by dividing total infiltration amount by the storm duration.
- Infiltration rates vary as function of the following:
- The condition of the land surface (crust)
- The type, extent, and density of vegetative cover
- The physical properties of the soil, including grain size and gradation
- The storm character. i.e., intensity, depth, and duration
- The water temperature
- The water quality, including chemical constituents and other impurities
- In general, as a function of physical, chemical, and biological properties of the soil mass.
Infiltration formulas
- Infiltration rates have a tendency to decrease with time.
- This fact led Horton to develop his decay formula for infiltration:
- in which f = instantaneous infiltration rate;
fo = initial infiltration rate;
fc = final infiltration rate;
k = a decay constant;
t = time.
- This equation has three parameters: initial rate fo, final rate fc, and decay constant
k.
- With a knowledge of the final rate, two sets of measurements can be solved to give initial rate and constant k.

Fig. 2-13
|
|
- Typical infiltration rates at the end of 1 hr are shown in Table 2-3.
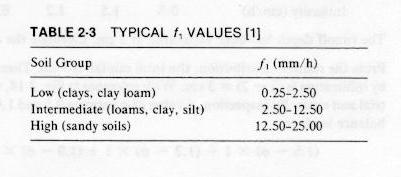
Table 2-3
|
|
Infiltration Index
- Practical evaluations of infltration rate have been hampered by its spatial and temporal variability.
- This has led to the concept of infiltration index.
- Infiltration index assumes that the rate is constant throughout the storm.
- It underestimates the initial rate and may overestimate the final rate.
- Best suited for long-duration storms.
- In this case, the neglect of variation with time is justified in practice.
- The φ-index is defined as the constant infiltration rate to be substracted from the prevailing rainfall rate
in order to obtain the runoff volume that actually occurred.
- Calculation is by trial and error.
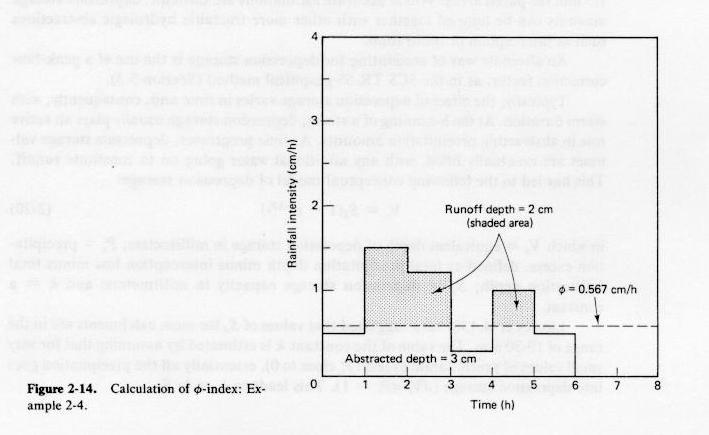
Fig. 2-14
|
|
Surface or depression storage
- Surface or depresion storage is the process by which precipitation is abstracted by being retained in puddles, ditches,
and other natural or artificial depressions of the land surface.
- Spatial variability of storage in surface depressions precludes its precise calculation.
- Depression storage is inversely related to catchment slope.
- NRCS's TR-55 model uses a surface storage correction factor F to account for depression storage (small ponds occupying less than 5 percent
of the catchment area).
- Conceptual model of depression storage:
in which:
- Vs = equivalent depth of depression storage (mm).
- Pe = precipitation excess; i.e., precipitation minus interception minus infiltration
- Sd = depression storage capacity (mm)
- k = a constant.
- For very small values of Pe, essentially all the precipitation goes into depression storage (dVs/dPe = 1).
- Therefore, value of k is estimated as 1/Sd.
Evaporation
- Evaporation is the process by which water accumulated on the land surface is converted into vapor state and returned to the
atmosphere.
- Evaporation occurs at the evaporation surface, the contact between water body and overlying air.
- Evaporation refers to the net rate of water loss from the body of water to the atmosphere.
- Evaporation is expressed in mm/day, cm/day, or in/day.
- Evaporation rate is a function of meteorological and environmental factors.
- Those factors important from an engineering standpoint are:
- Net solar radiation
- Saturation vapor pressure
- Vapor pressure of the air
- Air and water temperatures
- Wind velocity
- Atmospheric pressure
- Evaporation rates depend on the climate.
- In the U.S., evaporation rates vary from 20 inches in Maine to 86 inches in Arizona.
- Methods for determining evaporation:
- Water budget
- Energy budget
- Mass-transfer techniques
Water budget method
- Assumes that all relevant water-transport phases can be evaluated for a period of
time Δt, and expressed in terms of volumes.
- Reservoir or lake evaporation can be evaluated as follows:
in which
E= volume evaporated from the reservoir
P = precipitation falling directly into the reservoir
Q = surface runoff inflow into the reservoir
O = outflow from the reservoir
I = net volume infiltrated from the reservoir into the ground
ΔS = change in stored volume.
- Precipitation is readily measured.
- Inflow and outflow can be obtained by integrating flow records.
- Net infiltration can be evaluated only indirectly, either by measuring soil permeability or monitoring changes in groundwater level in nearby wells.
- Change in stored volume is determined by means of water stage recorders.
Energy budget method
- During evaporation, significant energy exchanges occur at the evaporating surface.
- A balance of these energy exchanges leads to the energy budget method.
- The amount of heat required to convert one gram of water into vapor, i.e., the heat of vaporization,
varies with the temperature.
- At 20oC, the heat of vaporization is 568 calories.
- Heat must be supplied for evaporation to take place.
- Radiation is the emission of energy in the form of electromagnetic waves.
- Solar radiation received at the Earth's surface is a major component of the energy balance.
- Solar radiation reaches the outer surface of the atmosphere at a nearly constant flux of 1.94 cal/cm2/min, of 1.94 langleys/min.
- 1 langley = 1 cal/cm2.
- Nearly all of this radiation is of wavelengths in the range 0.3-3.0 μm,
with about half in the visible range (0.4-0.7 μm).
- The Earth also emits radiation, but since its surface temperature is about 300oK, this terrestrial radiation is of much lower intensity
and greater wavelength (3-50 μm) than solar radiation.
- It is customary to refer to solar radiation as short-wave radiation,
and to terrestrial radiation as long-wave radiation.
- The fraction of original solar radiation that reaches the Earth's surface is called direct solar radiation.
- The fraction that is reaches the ground after reflection and scattering is called sky radiation.
- The sum of these two is global radiation.
- Albedo is the reflectivity coefficient of a surface toward shortwave radiation.
- This coefficient varies with color, roughness, and inclination of the surface.
- It is 0.1 for water, 0.1-0.3 for vegetated areas, 0.15-0.4 for bare soil, and 0.7-0.9 for snow-covered areas.
- In addition to short wave radiation, there is also a long-wave radiation balance (Figure).
- The Earth also emits radiation, part of which is absorbed and reflected back by the atmosphere.
- The difference between outgoing and incoming fluxes is called long-wave radiation loss.
- At night, long-wave radiation predominates.
- Net radiation is equal to the net short-wave (solar) radiation minus the long-wave (terrestrial) radiation loss.
- Incoming energy:
|
Qi = Qs (1 - A) - Qb + Qa
|
in which
Qi= incoming energy
Qs = global radiation
A = albedo
Qb= long-wave radiation loss
Qa = net energy advected into the waterbody by streams, rain, snow, etc.
- Outgoing energy:
in which
Qo = energy expenditure
Qh = sensible heat transfer from waterbody to atmosphere by convection and conduction
Qe = energy used in the evaporation process
Qt = increase in energy stored
- The energy used in the evaporation process is:
in which
Qe= energy used in evaporation process (cal/cm2/day)
ρ = density of water (gr/cm3)
Υ = heat of vaporization (cal/gr)
E = evaporation rate (cm/day)
|
B = Qh / Qe = γ [(Ts - Ta)/(es -ea)] (p/1000)
|
in which
B = Bowen's ratio
γ = a psychrometric constant equal to 0.66 mb/oC
Ts = water surface temperature, oC
Ta = overlying air temperature, oC
es= saturation vapor pressure at the water surface temperature, mb
ea= vapor pressure at the overlying air temperature, mb
p = atmospheric pressure, mb
|
E = [Qs (1 - A) - Qb + Qa - Qt] / [ρ Υ (1 + B)]
|
- The quantities Qs (1 - A) and Qb can be measured with radiometers.
- The quantity Qa can be determined by measuring volumes and temperatures of the water flowing into and out of the body.
- The quantity Qt is evaluated by periodic measurements of water temperature.
Mass-transfer approach
- Evaporation rates are dependent on the temperature of the water surface and the prevailing atmospheric pressure.
- Higher water temperatures result in higher evaporation rates.
- Higher atmospheric pressure results in lower evaporation rates.
- Temperature has a larger effect than atmospheric pressure on evaporation.
- Evaporation rates are a function of the difference between the saturation vapor pressure at the water surface temperature es
and the vapor
pressure of the overlying air ea (partial vapor pressure).
- The saturation vapor pressure is a function of temperature
(Table A-1 and
Table A-2).
- The partial vapor pressure can be obtained by multiplying the saturation vapor pressure at the air temperature eo
by the relative humidity of the air (%) and dividing by 100.
- As the process of mass-transfer continues, the lowest layer of the atmosphere eventually becomes saturated, and net evaporation reduces to zero
and can become negative (condensation).
- Wind carries away water molecules and helps continuous evaporation.
- The Dalton formula considers both vapor pressure gradient and wind effects.
- The Meyer formula is an example of mass-transfer evaporation (daily and monthly formulas):
|
E = Cd (es - ea) [1 + (W/10)]
|
|
E = Cm (eo - ea) [1 + (W/10)]
|
|
E = Cm eo [1 - (RH%/100) ] [1 + (W/10)]
|
Penman method (Combination energy budget-mass transfer method)
Evaporation determinations using pans
- Evaporation pan is a device to measure evaporation by monitoring the loss of water in a pan during one day.
- It provides an integrated effect of net radiation, wind, temperature, and humidity on evaporation from an open surface.
- The measurement is likely to be somewhat greater than the actual evaporation.
- The ratio of lake-to-pan evaporation is an empirical constant referred to
as pan coefficient.
Evapotranspiration
Temperature models to estimate evapotranspiration
- The Blaney-Criddle formula has been used to estimate crop water requirements.
- in which
- f = daily consumptive use factor (mm)
- p = ratio of mean daily daytime hours for a given month to total daytime hours in the year (%), a function of latitude (Table A-3)
[average monthly value = (100%)/12 = 8.33%; daily value at 0o latitude, 8.33/30.4 days/mo= 0.27]
- t = mean daily temperature (oC)
- Consumptive water requirement is the consumptive use factor f times a crop coefficient kc.
(Table 2-5)
- Doorenbos and Pruitt have proposed a modification of the Blaney-Criddle formula:
in which
- ETo = reference crop evapotranspiration
- a and b = constants that vary with actual insolation time (ratio n/N between actual and maximum possible bright sunshine hours),
minimum relative humidity (%), and daytime wind speed (m/s).
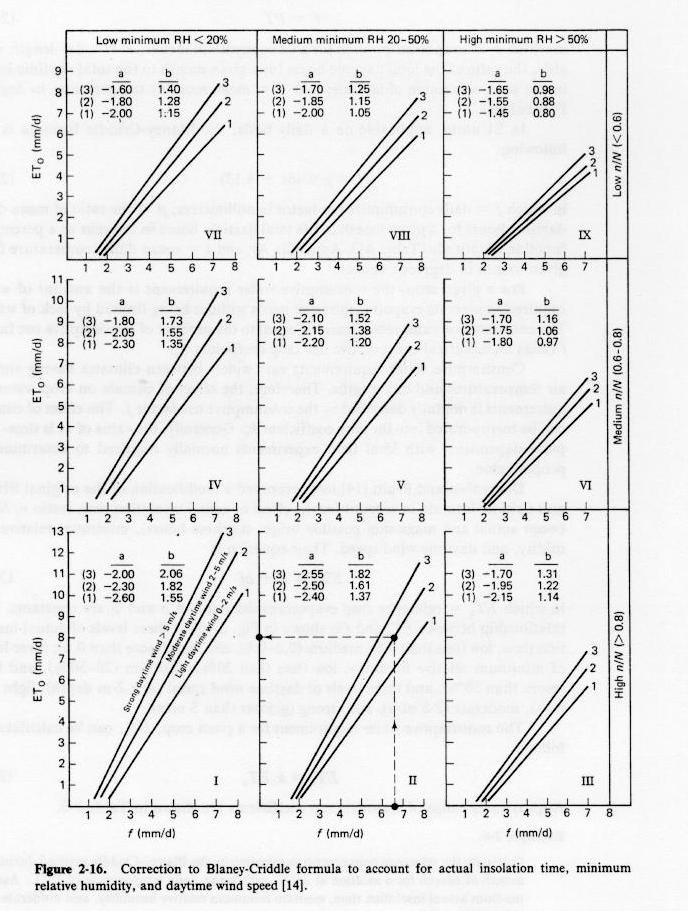
Fig. 2-16
|
|
- The consumptive water requirement for a given crop is:
- kc varies with each crop, from 0.15 to 1.1 (Table 2-5).
- The Thornthwaite method is also widely used to estimate potential evapotranspiration.
- The method is popular because it is based only on temperature, which is widely available.
- The method is based on an annual temperature efficiency index J, defined as the sum of 12 monthly values of heat index I.
- Each monthly index I is a function of mean monthy temperature T, in oC:
- Evapotranspiration at zero latitude PET(0) in cm/month is calculated by the following formula:
|
c = 0.000000675 J3 - 0.0000771 J2 + 0.01792 J + 0.49239
|
- At other latitudes, evapotranspiration PET (in cm/month) is calculated by the following formula:
- K is a constant for each month of the year, varying as a function of latitude
(Table A-4).
Radiation models
- Priestley and Taylor proposed that potential evapotranspiration be taken as the radiation part of the
Penman equation, affected with an empirical constant.
|
PET = 1.26 Δ [Qn/(ρ Υ)] / ( Δ + γ)
|
|
PET = 1.26 α [Qn/(ρ Υ)] / ( α + 1)
|
-
However, the constant 1.26 may vary with climatic conditions (it has been reported to be 1.7 in arid regions).
Combination models to estimate evapotranspiration
- The original Penman model provided an estimate of evaporation from a free surface.
- Experimental crop coefficients were suggested to convert to evapotranspiration.
- These coefficients (0.6 in the winter and 0.8 in the summer) were intended to multiply the evaporation
to get evapotranspiration.
- Other studies have suggested that free-water-surface evaporation and evapotranspiration are nearly the same.
- It seems that energy-budget and mass-transfer components compensate themselves to make evaporation and evapotranspiration nearly equal.
- Potential evapotranspiration correlates well with combination data such as solar radiation and wind velocity.
- Pan evaporation models are also used in evapotranspiration studies.
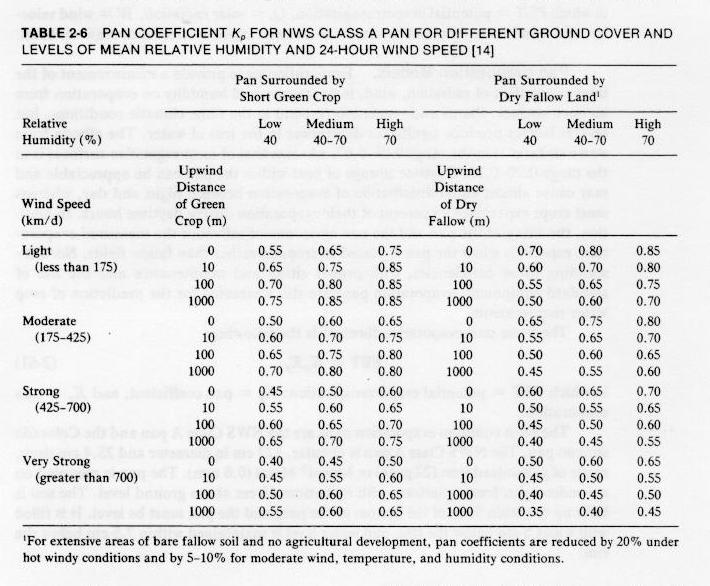
Table 2-6
|
|
- NWS Class A pan is generally used for estimating potential evapotranspiration.
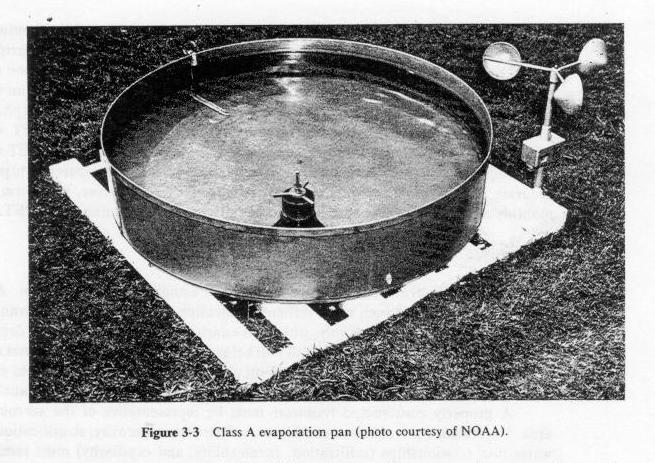
Fig. 3-3
|
|
Go to Chapter 2C.
|
