|
|
CIVE 445 - ENGINEERING HYDROLOGY
CHAPTER 2C: BASIC HYDROLOGIC PRINCIPLES, CATCHMENT PROPERTIES
|
- Surface runoff in catchments occurs as a progression of the following forms:
- A catchment area can be as little as 1 ha to hundreds of thousands of square kilometers.
- In small catchments (watersheds), runoff is controlled by overland flow processes.
- In large catchments (river basins), runoff is controlled by storage processes in the river channels.
- In midsize catchments (large watersheds or small basins), runoff is controlled by both overland flow (kinematic)
and channel storage (diffusion).
- The hydrologic characteristics of catchments, watersheds, basins are described in terms of the following properties:
- Drainage Area
- Catchment shape
- Catchment relief
- Linear measures
- Drainage patterns
Catchment Area
- Drainage area determines the potential runoff volume, provided the storm covers the whole area.
- The larger the catchment, the less likely that the storm will cover all the area.
- The collection of peaks and saddles determine the location (loci) of the catchment divide.
- The topographic divide may not coincide with the hydrologic divide (subsurface flow)
- Unless there is a detailed groundwater flow evaluation, the topographic divide is used as a hydrologic divide.
- Runoff originates at high points and moves toward lower points in a direction perpendicular to the terrain's contour lines.
- Several formulas have been proposed to relate peak flow to catchment area.
- A basic formula is:
in which:
Qp = peak flow
A = catchment area
c and m = constants.
Catchment Shape
- Horton described the outline of a normal catchment as a pear-shaped ovoid.
- A form ratio is defined as:
in which:
Kf = form ratio
A = catchment area
L = catchment length, measured along the longest watercourse.
- An alternate description is based on catchment perimeter rather than area.
- For this purpose, an equivalent circle is defined as a circle of area equal to that of the catchment.
- The compactness ratio is the ratio of the catchment perimeter to that of the equivalent circle.
|
Kc = Pc / [2 (π)1/2 Ac1/2]
|
in which:
- Catchment response refers to the relative concentration and timing of runoff.
- A high form ratio or a compactness ratio close to 1 describes a catchment having a fast and peaked catchment response.
- Other factors such as relief, vegetative cover, and drainage density are usually more important than shape in determining catchment response.
Catchment relief
- Maximum catchment relief is the elevation difference between the highest point in the catchment divide and the lowest point,
located at the catchment outlet.
- The principal watercourse is the largest watercourse, and the one conveying the flow to the outlet.
- Relief ratio is the ratio of maximum catchment relief and the longest horizontal distance, measured along the principal watercourse.
- The relief ratio is a measure of the intensity of erosional processes, or geodynamics.
- Relief is quantitatively described with a hypsometric curve.
- This is a dimensionless plot of the variation of surface area with elevation.
- To develop a hypsometric plot, several elevations are selected, and each elevation is
associated with a partial area above that elevation.
- Elevations and partial areas are expressed in percentage of the maximum height and area, respectively.
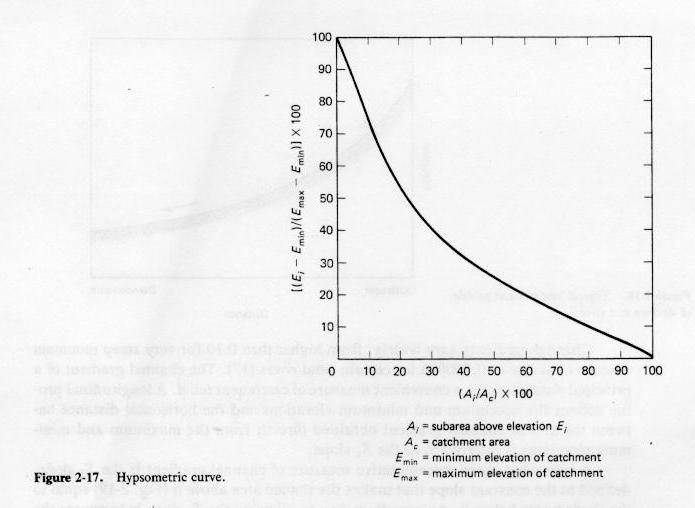
Fig. 2-17
|
|
- The longitudinal profile of a channel is a plot of elevation vs horizontal distance.
- Channel slope or channel gradient is the ratio of vertical to horizontal distance.
- In the absence of geologic controls, longitudinal profiles are usually concave when viewed from above.
- Channel gradients are directly related to bottom friction and inversely related to flow depth.
- Typically, friction decreases and flow depth increases in the downstream direction.
- If the profile is convex, there are geologic controls (rock outcroppings) acting to invalidate the geomorphological principle.

Fig. 2-18
|
|
- Channel gradients vary widely, from steeper than 0.1 to as mild as 0.000006.
- The channel gradient obtained from the maximum and minimum elevations is referred to as S1 slope.
- The S2 slope is the constant slope that makes the shaded area above it equal to the shaded area below it.
- An expedient way to calculate the S2 slope is to equate the total area below it to the total area below the longitudinal profile.

Fig. 2-19
|
|
- S3 equivalent slope takes into account the basin response time.
- The channel is divided into n subreaches, and a slope calculated for each subreach.
- The time of travel through each subreach is directly proportional to its length and
inversely proportional to its velocity, i.e., to the square root of its slope (the Manning equation).
- The time of travel through the whole channel is assumed to be directly proportional to its length and
inversely proportional to the square root of S3.
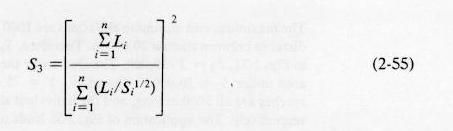
Eq. 2-55
|
|
- The USGS State Equations compute channel slope S between two points located at
10% and 85% of the channel, measured in the upstream direction.
- The NRCS (ex SCS) determines
average surface slope by overlying a square grid pattern over a topographic map of the watershed.
- The maximum slope at each intersection is evaluated, and the average of all values calculated.

Fig. 2-20
|
|
Linear Measures
- The catchment length (or hydraulic length) is the length measured along a principal watercourse.
- The length to catchment centroid is the length
measured along the principal watercourse, from the catchment outlet to a point
located closest to the catchment centroid.
-
Stream order is essential to the hierarchical description of streams.
- Overland flow is of hypothetical zero order.
- A first-order stream receives flows from zero-order streams.
- Two first-order streams combine to form a second-order stream.
- The catchment's stream order is the order of the main stream at the mouth.

Figs. 2-22 and 2-23
|
|
Drainage density
- The catchment's drainage density is the ratio of total stream length to catchment area.
- A high drainage density reflects a fast and peaked runoff response.
- A low drainage density is characteristic of a delayed response.
- The mean overland flow length is approximately equal to half the mean distance between stream channels.
- It can be estimated as one-half of the reciprocal of the drainage density.
- This approximation neglects the effect of channel and surface (ground) slope, which increases the value of Lo.
- Use the following equation to include channel and surface slope into overland flow length calculation:
|
Lo = 1 / {(2D) [1 - (Sc / Ss)]}
|
Drainage patterns
- Drainage patterns vary widely.
- Types of drainage patterns that are recognizable on aerial photos are shown in Fig. 2-24.
- There patterns reflect geologic, soil, and vegetation effects, and are related to hydrologic properties such as runoff response or
annual water yield.
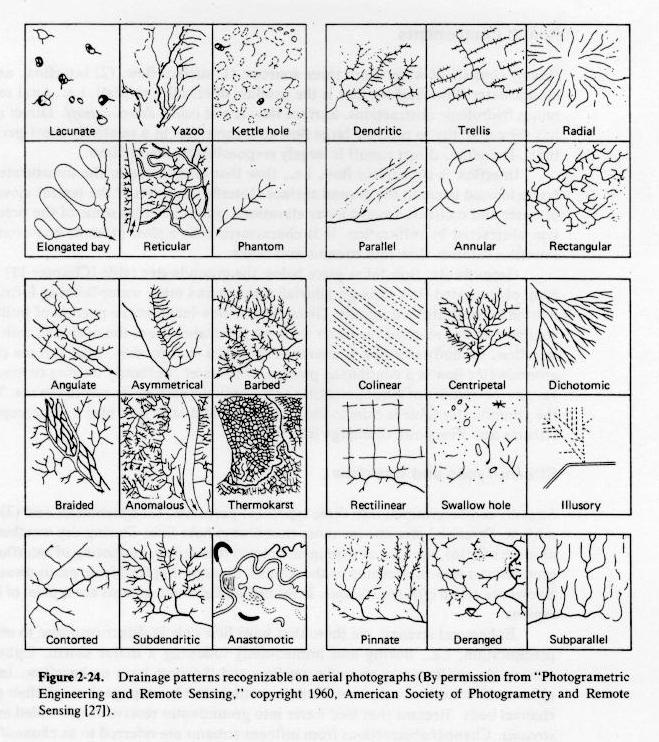
Fig. 2-24
|
|
Go to Chapter 2D.
|