IS A SEDIMENT RATING CURVE REALLY CURVED?
San Diego State University, San Diego,
California
1. INTRODUCTION
A sediment rating curve is a relation between
water discharge Q in the abscissas and sediment
discharge Qs in the ordinates. It is used in the field of
river mechanics and sedimentation
engineering to readily convert from one discharge to the other,
normally from Q to Qs (ASCE, 1975; 2007).
In this article we endeavor to explain the intricacies of the sediment rating curve.
We explain how ecology took some liberties with alluvial streams to create an environment
where fish and other stream biota would continue to flourish
in spite of the fact that the local
climate did not appear to be cooperating.
2. THREE BASIC TRUTHS
Truth No. 1.
The ratio between sediment discharge Qs
and water discharge Q is referred to as the sediment concentration
Cs (Eq. 1). Under steady equilibrium flow conditions in an alluvial stream,
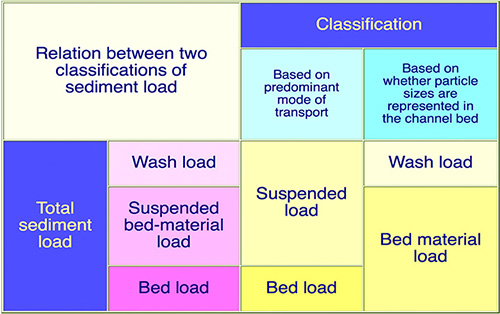
Truth No. 2. An alluvial stream will transport sediments originating in the streambed, i.e.,
the bed-material load,
in two distinct
ways: (1) by rolling and sliding
along the bed, that is, the bed load, and
Truth No. 3. Flow in an alluvial channel
may be of two types: (1) lower regime, and (2) upper regime.
The change from high friction in low flows to low friction in high flows
has the net effect of reducing the variation
in stage for a given variation
in discharge.
Therefore, the stage is higher than normal for low flows, and lower than normal for high flows.
In summary, the three basic truths of sediment transport mechanics are:
3. ULTIMATE SEDIMENT CONCENTRATION
In engineering practice, the following power function is used
to provide a fit between measured water and sediment discharge data:
in which c and m are coefficient and exponent of the sediment rating curve, respectively.
In Equation 2, for the special case of m = 1, the sediment concentration (Eq. 1)
is independent A widely used sediment transport formula is the following (Colby, 1964):
in which qs = unit-width sediment discharge; k = bed-material transport parameter, a function of sediment properties, including mean particle size, gradation, and specific weight; ρ = density of water; v = mean flow velocity; and n = exponent (Ponce, 2014a). Colby (1964) showed that n ≅ 7 is typical of low-water discharges, while n ≅ 3 is typical of high-water discharges. In fact, n = 3 is a characteristic asymptotic lower limit for n, rendering dimensionless the bed-material transport parameter k in Eq. 4:
Since n = 3 is typically associated with high-water discharges, Eq. 4 may be used to calculate the ultimate sediment concentration. The water discharge, per unit width, is:
in which d = flow depth. Equation 1 is recast in terms of unit-width variables as follows:
Substituting Eqs. 4 and 5 into Eq. 6 leads to the equation for ultimate sediment concentration Cs' :
in which F = Froude number, defined
as F = v /(gd )1/2;
g = gravitational acceleration; and
γ is the specific weight of water (γ = ρ/g).
For example, with k = 0.1, F = 0.4, and γ = 1,000 mg/L,
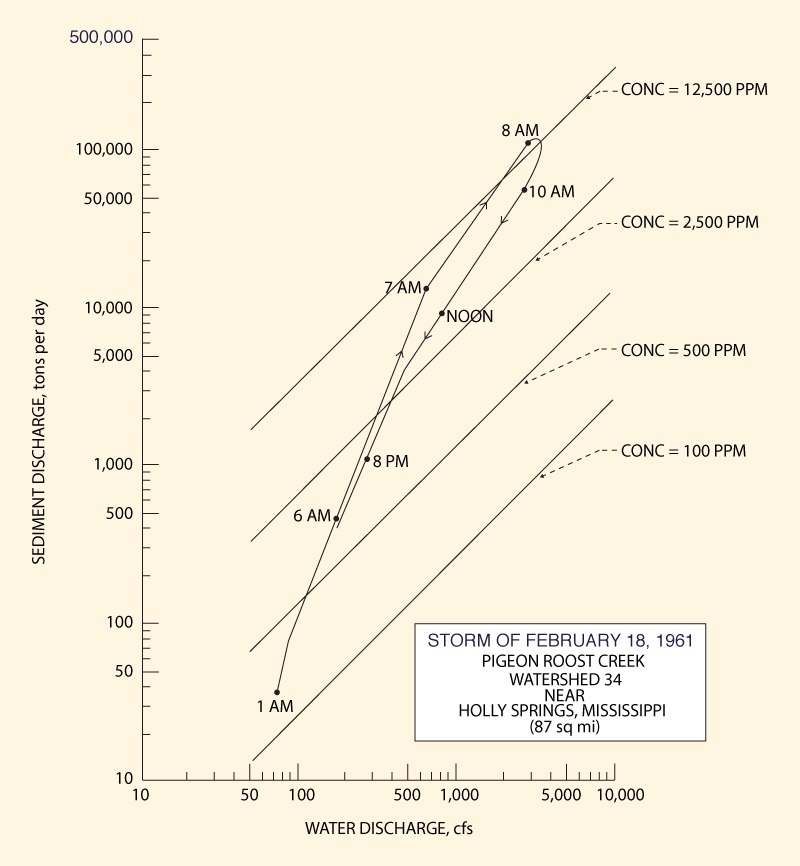
Figure 3 shows a sediment rating curve for Watershed 34, of surface area equal to 87 square miles,
at Pigeon Roost Creek, near Holly Springs,
Mississippi, measured during the storm of February 18, 1961.
[This figure has been extracted from p. 476, Chapter IV-C of the ASCE
Sedimentation Engineering
4. NATURE OF A SEDIMENT RATING
We have established that a sediment rating curve characteristically
has a curved shape, wherein
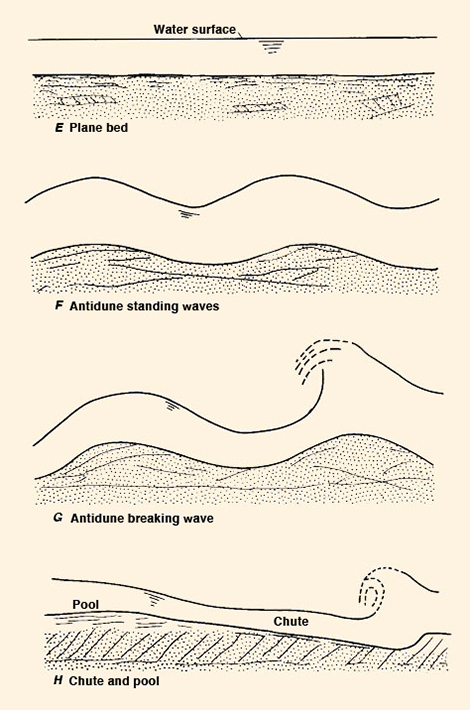
Fact No. 1. At sufficiently low flows, alluvial streams
transport their bed material at a concentration constantly growing with increasing
Q. At these low flows, both grain and form friction are present,
since the low flow velocities are conducive to the development
of form friction, manifested as ripples and dunes.
In effect, the bed configuration turns out to be
ripples and dunes [Fig. 2 (a): A, B, and C].
Fact No. 2. At sufficiently high flows,
alluvial streams transport their bed-material load
at a constant maximum
concentration, referred to as the "ultimate sediment concentration"
(Eq. 7).
There is a reason for this interesting and somewhat
fascinating physical behavior of a sediment rating.
The local bed-material sediment concentration should reflect the local transport capacity
of the stream. If the channel boundary were rigid, the sediment concentration
ought to be unique or close to unique, that is, not to vary appreciably with the flow.
But in an alluvial channel, the facts bear otherwise:
We affirm that at low flows,
the presence of lower-regime bedforms does not permit
the flow to carry its maximum sediment load, in effect reducing it to a fraction of its equilibrium
value.
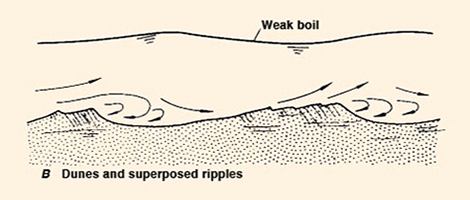
Conversely, at high flows, the swiftness of the current acts to obliterate the lower-regime bedforms,
reducing the boundary friction to grain friction only [Fig. 4 (b)]. This
enables the high flow to transport the maximum sediment load that it possibly can.
A splendid corollary of the present analysis may be stated as follows:
If it were not for the lower-regime bedforms,
the entire sediment transport problem could be encapsulated into Eq. 7, i.e.,
the calculation of sediment transport by simply resorting
to a sole value of sediment concentration, the "ultimate sediment concentration."
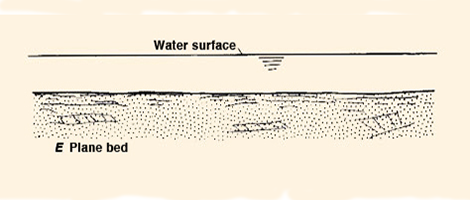
Fig. 4 (a) Dunes and superposed ripples configuration.
Fig. 4 (b) Plane bed configuration.
We close this section with a relevant quote from Prof. Hans A. Einstein (1950), p. 9:
It is seen that Einstein saw fit not to include the energy spent in overcoming the lower-regime bedforms in his bedload function. This fact underscores the concept that the ultimate sediment concentration is indeed a ceiling for the actual sediment concentration, confirming the true nature of the sediment rating.
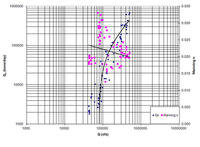
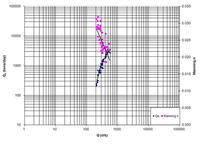
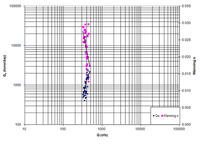
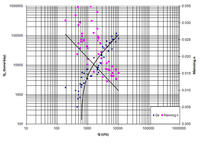
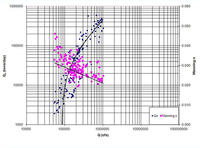
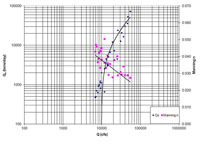
5. FIELD VERIFICATION
Ponce and others (2012) used a comprehensive data set
originally compiled by Williams (1995) to compare six (6) measured sediment rating curves
with their corresponding frictional values as measured by Manning's n.
The objective was to ascertain the inverse relation between sediment transport and boundary friction:
The greater the latter, the smaller the corresponding water and sediment discharge,
and vice versa.
The following six sets of Brownlie's data (Brownlie 1981a, 1981b) were used by Ponce and others (2012):
63 data points from the Atchafalaya River.
40 data points from the Niobrara River.
38 data points from the Middle Loup River.
51 data points from the Rio Grande River.
156 data points from the Mississippi River.
29 data points from the Red River.
Measured sediment rating curves, including a graphical best fit, are shown in Fig. 5.
(friction data points are shown in magenta) (Ponce and others, 2012).
6. CONCLUSIONS
The nature of a sediment rating curve has been
reviewed, explained, and clarified. The "ultimate sediment concentration" is
the maximum concentration that may be attained in the absence of form friction. Its
value may be readily calculated based on flow and sediment properties using Eq. 7.
The shape
of the
actual sediment rating is curved, wherein the slope of the curve is high for the lower flows,
around 7, and decreases asymptotically for the higher flows to the characteristically low
The above rationale clarifies the reason for the demonstrated drop
in sediment transport for low flows and, therefore, explains
the shape of a typical sediment rating curve.
A verification with field data confirms the findings of this study:
REFERENCES
ASCE, 1975. Sedimentation Engineering. Manuals and Reports on Engineering Practice, Manual 54,
Vito A. Vanoni, editor, New York.
ASCE, 1975. Sedimentation Engineering.
Manuals and Reports on Engineering Practice, Manual 54: p.476.
ASCE, 2007. Sedimentation Engineering: Processes, Measurements, Modeling, and Practice.
Manuals and Reports on Engineering Practice, Manual 110,
Marcelo H. Garcia, editor, New York.
Brownlie, W. L. (1981a). Prediction of flow depth and sediment discharge in open channels. Report KH-R-43A, W.M. Keck Laboratory of Hydraulics and Water Resources, California Institute of Technology, Pasadena, California.
Brownlie, W. L. (1981b). Compilation of alluvial channel data: Laboratory and field. Report KH-R-43B, W.M. Keck Laboratory of Hydraulics and Water Resources, California Institute of Technology, Pasadena, California.
Colby, B. R. 1964. Discharge of sands and mean velocity relations in sand-bed streams.
U.S. Geological Survey Professional Paper 462-A, Washington, DC.
Einstein, H. A. (1950). The bed-load function for sediment transportation
in open-channel flows.
USDA Soil Conservation Service, Technical Bulletin No. 1026, Washington, DC, September.
Kennedy, J. F. 1983.
Reflections on rivers, research, and Rouse.
Journal of Hydraulic Engineering ASCE, 109(10), 1257-1260.
Ponce, V. M. 1988. Ultimate sediment concentration.
Proceedings, National Conference on Hydraulic Engineering,
Colorado Springs, Colorado, August 8-12, 311-315.
Ponce, V. M. 1995.
Hydrologic and environmental impact of the Parana-Paraguay waterway on the Pantanal of Mato Grosso, Brazil.
https://ponce.sdsu.edu/hydrologic_and_environmental_impact_of_the_parana_paraguay_waterway.html
Ponce, V. M., D. S. Smith, and R. D Aguilar. 2012.
Effect of form friction on the sediment rating curve.
Online article.
Ponce, V. M. 2014a.
Engineering Hydrology: Principles and Practices.
Online textbook.
Ponce, V. M. 2014b.
Fundamentals of Open-channel Hydraulics.
Online textbook.
Simons, D. B., and E. V. Richardson. 1966.
Resistance to flow in alluvial channels. Geological Survey Professional Paper 422-J,
U.S. Government Printing Office, Washington, D.C.
Williams, D. T. (1995).
Selection and predictability of sand transport relations based upon a numerical index.
|

| 231127 |