|
THOMPSON CREEK GROUNDWATER SUSTAINABILITY STUDY
Victor M. Ponce
07 May 2012
|
The groundwater resources of Thompson Creek, in Poway, California,
are limited and not readily replenishable. Existing hand-dug wells indicate that the water table
was higher, i.e., much closer to the surface, prior to the extensive groundwater development
of the past 15 to 20 years. Significantly, a spring in Lower Thompson Creek, documented by USGS in the 1980s,
is no longer there.
Aquifer depletion amounts to as much as 280 feet in certain areas.
This amount is large compared with four classic textbook examples of groundwater depletion, which range from 150 to 300 feet.
Over the past 12 years, the average capture-to-recharge percentage in Thompson Creek and vicinity has been 109%. To provide a measure of comparison, the average capture-to-recharge percentage in the continental
United States is about 8.7%.
Capture of 100% or more of the recharge, with the intent to make
maximum use of the available groundwater, has been widely discredited.
The obsolescence of the concept of "safe yield" has
cast serious doubts into the practice of using groundwater to support
turf irrigation at Maderas Golf Club and other areas.
Expert scientific opinion now recommends the determination of a sustainable yield,
interpreted as a reasoned, suitable fraction of the recharge.
Therefore,
the use of groundwater for extensive turf irrigation
should be discouraged, or else reduced
to an amount consistent with
current practices of groundwater sustainability.
All groundwater originates in rainfall; therefore, the documented depletion at Thompson Creek
must be because
pumping is exceeding replenishment. Since Maderas Golf Club is pumping close to 70% of the total volume,
it follows that they must account for about two-thirds of the groundwater depletion in the basin.
Capturing an average value of 109% of the gross annual
recharge is clearly not sustainable.
|
1. INTRODUCTION
1.1 Overall setting
Thompson Creek is located within the city of Poway, in San Diego County, California. Thompson Creek is a tributary of Sycamore Creek, itself a tributary of the San Dieguito river. The Thompson Creek watershed is home to rural communities, among them, Old Coach Estates. Thompson Creek and environs are also home to Maderas Golf Club, a 160-acre facility that opened in the year 1999. Maderas is a large user of water, including groundwater.
A groundwater sustainability study seeks to assess the extent of groundwater depletion by pumping and capture, and to determine the steps that must be taken to correct the imbalance. In these times of intense competition for water resources, particularly in Southern California, groundwater depletion is a pervasive problem, in much need of attention by local government agencies.
The communities of Thompson Creek, particularly Old Coach Estates, depend on groundwater for their livelihood. Half of the households in Old Coach Estates (12 out of 24) depend exclusively on groundwater. Maderas Golf Club is the largest single user of groundwater in the basin. The use of groundwater by Maderas amounts to about 70% of all the groundwater being pumped in Thompson Creek and environs (Section 3.5). The competition between Maderas and its Old Coach neighbors for the local groundwater resources has been going on for the past 15 years.
At the request of the City of Poway, a hydrological study of the Sycamore Creek subbasin was funded by Maderas and carried out by Howard Engineering in the year 2000. This study recommended the setting of a preliminary and temporary limit of 309 acre-feet/year for production of groundwater from the subbasin (Don Howard Engineering, 2000). Of this amount, the Howard study recommended that 256 acre-feet be alloted to Maderas Golf Club and 53 acre-feet to the homeowners. The number of households considered in the Howard study was approximately 60, amounting to an average of 0.88 acre-feet per household.
Groundwater production at the Maderas well field in the 12-year period from 2000 to 2011 has ranged from 85 acre-feet in 2006 to 206 acre-feet in 2010 (SCS Engineers, 2010; 2012). The average annual pumping during this period has been 164 acre-feet. Maderas has been authorized by the City of Poway through a Conditional Use Permit (CUP) to pump up to 280 acre-feet/year.1
Since the year 2000 and, more recently, since the year 2009, concerns by Old Coach neighbors have arisen regarding the possibility of groundwater depletion in the Thompson Creek watershed. In response to escalated concern from local residents over the level of water in their wells, the City of Poway directed Maderas to cease the use of all groundwater as of August 18, 2011.2 At the same time, the City of Poway acknowledged that Maderas would process an amendment to the CUP to modify or eliminate the conditions relating to limitations on pumping.
In October of 2011, prompted by the prospect of more groundwater depletion, the Old Coach Estates neighbors organized to support this study of groundwater sustainability. Groundwater sustainability refers to the assessment of groundwater depletion, its probable causes, and the steps that are necessary to reverse the perceived negative trend.
This report documents the issues of groundwater sustainability in general and the sustainability of the Thompson Creek aquifer in particular. The objective is to evaluate whether current practices and amounts of groundwater pumping can be sustained over time.3 A second objective is to determine a level of use commensurate with local and regional hydrological and ecohydrological conditions and related socioeconomic factors.
1.2 The choice of surface water vs groundwater
The problem confronting Thompson Creek stakeholders has to do with the choice of surface water vs groundwater. Surface water is expensive because it must be transported over long distances. In San Diego County, about 80% of the supplied surface water originates in the Colorado river basin and Northern California (San Diego County Water Authority). Groundwater is cheaper because it lies just below the ground, at relatively close range. Naturally, this leads to intense competition for the local groundwater resources, while there is less demand for surface water.
Two important properties distinguish surface water from groundwater. First, surface water is renewable, while groundwater is not renewable in the short term. Second, the qualities of surface water and groundwater differ in one important respect: natural surface waters tend to be fresh, while natural groundwaters tend to grade from fresh to saline, the salinity content increasing with depth and age (Freeze and Cherry, 1979).
In the Thompson Creek watershed, both Maderas and its neighbors prefer to use groundwater because of its lower cost. Some neighbors are using renewable energy (solar or wind) to pump their wells; therefore, their monthly electric bill is minimal, if not zero. It is clear that Maderas prefers to use groundwater, even though the terms of the City of Poway's Conditional Use Permit (CUP) issued in the year 2000 clearly stipulate that groundwater should be used only as the last resort, after three types of surface water (reclaimed, untreated, and potable).
The groundwater resource is limited. Too much groundwater pumping will end up depleting the aquifer. Replenishment may take a long time, usually longer than most people are willing to wait. A limit must be imposed on groundwater pumping to avoid: (a) the deepening of wells, (b) the increased cost associated with deeper pumping using conventional energy, and (c) the increased risk of salt pollution of the land and neighboring surface waters as a result of deeper groundwater mining (Alley, 2003 [1]). The remaining sections of this report (Sections 2 to 10) endeavor to explain and clarify the hydrological and socioeconomic issues regarding the controversy.
2. SURFACE WATER
2.1 Drainage areas
Thompson Creek is one of three major tributaries of Sycamore Creek (see Fig. 2.1).
The other tributaries are Warren Canyon Creek and Green Valley Creek.
Lake Poway is in Warren Canyon; Lake Ramona is in Green Valley.
Warren Canyon Creek and Green Valley Creek join to form Sycamore Creek.
Downstream of this confluence, Sycamore Creek is joined by Thompson Creek,
and it continues downstream to join the San Dieguito River at the upstream end of Lake Hodges.
|
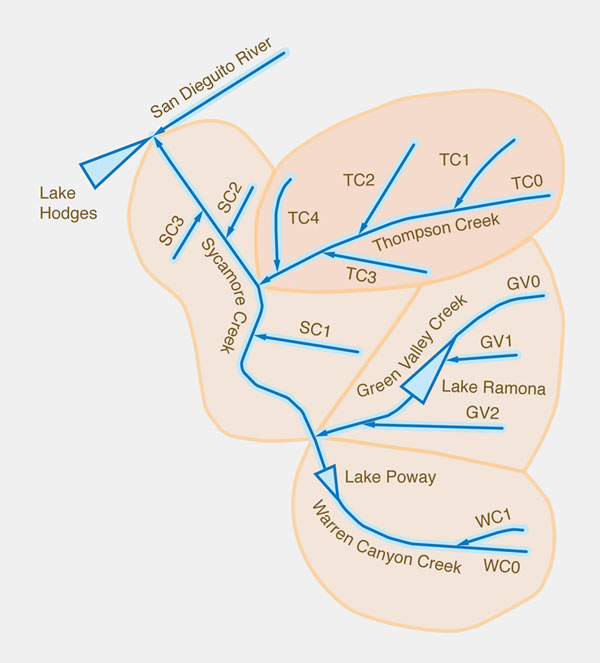
Thompson Creek has four tributaries, from upstream to downstream (Fig. 2.1). Sycamore Creek proper lies immediately west of Thompson Creek, and has three tributaries, from upstream to downstream (Fig. 2.1)
The total drainage area of the Sycamore Creek watershed is 8,236 acres. Of this total acreage, 1,885 acres
correspond to the Thompson Creek watershed. The four major Sycamore Creek contributing watersheds are summarized in Table 2.1.
| Table 2.1 Sycamore Creek contributing drainage areas | |
| Subwatershed | Area (acres) |
| [1] Warren Canyon Creek | 1733 |
| [2] Green Valley Creek | 2561 |
| [3] Thompson Creek | 1885 |
| [4] Sycamore Creek | 2057 |
| [ 1 + 2 + 3 + 4 ] Total drainage area | 8236 |
Maderas Golf Club and the communities of Old Coach Estates and The Heritage lie within the Thompson Creek and Sycamore Creek watersheds. Old Coach Estates consists of twenty-four (24) single-family homes comprised mostly within subwatersheds TC1 and TC2 of Thompson Creek. The Heritage consists of about seventy (70) single-family homes mostly in subwatershed TC4. A few other single-family homes are also contained within Thompson Creek and nearby Sycamore Creek areas.
Maderas Golf Club comprises about 160 acres within subwatersheds TC4 of Thompson Creek and SC2 of Sycamore Creek (Fig. 2.1). Thompson Creek runs through the Maderas property near its downstream end, from east to west. The property area of Maderas Golf Club includes 88 acres of warm-season Bermuda grass used as turf (SCS Engineers, 2010).4
2.2 Mean annual precipitation
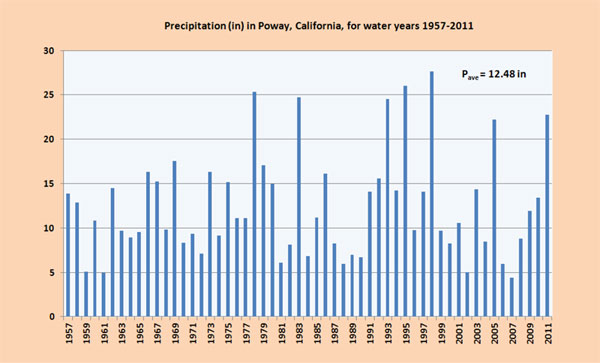
An assessment of mean annual precipitation is necessary to perform a water balance, required for a study of groundwater sustainability. Precipitation records are available for the Poway Valley Station for a total of 55 years.5 This record is shown in Fig. 2.2. Annual precipitation varied from a minimum of 4.36 inches for water year 2007 to a maximum of 27.62 inches for water year 1998. The mean annual precipitation for the entire period of record is 12.48 inches.
|
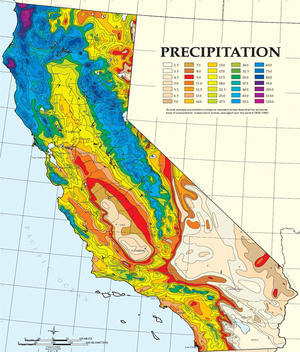
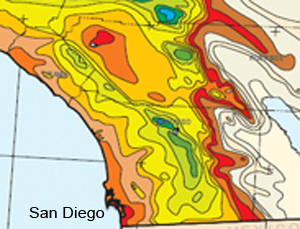
Poway Valley Station is located about 5 miles south of Thompson Creek. To complement the station analysis, mean annual precipitation at the site was estimated regionally at the intersection of Thompson Creek with Old Coach Road, at Lat. 33o 02' 04" and Long. 117o 01' 22". The precipitation map prepared by the California Department of Forestry and Fire Protection, shown in Fig. 2.3(a), was used for this purpose. The geographical detail for San Diego County is shown in Fig. 2.3(b). The mean annual precipitation at the given location is P = 13.5 in. Given the above analyses, mean annual precipitation applicable to the Thompson Creek basin is taken as to be 13 inches.
|
in San Diego County |
2.3 Water balance relations
A review of water balance relations is essential for the understanding of groundwater sustainability. All groundwater originates from percolation of surface water. Therefore, a complete analysis must consider both surface water and groundwater. Precipitation, the source of all moisture in the hydrological cycle, follows two distinct paths:
- Return to the
atmosphere as:
- 1. Evaporation
- 2. Evapotranspiration
- Return to the ocean as:
- 3. Direct runoff
- 4. Baseflow
- 5. Deep percolation.
Evaporation occurs in the absence of plants; conversely, evapotranspiration occurs in the presence and for the benefit of plants. Direct runoff contributes directly to the surface waters; baseflow passes through the groundwater reservoirs before joining the surface waters. Deep percolation flows directly into the ocean, bypassing the surface waters altogether.
A water balance separates annual precipitation into the five components mentioned above.
The actual percentages vary with basin scale
and local climatological, geomorphological, hydrological, geohydrological, and ecohydrological conditions.
The sum of direct runoff and baseflow is referred to as streamflow.
For peripheral continental regions, i.e., those draining directly into the ocean, a global hydrological balance indicates that
streamflow is about 39% of precipitation (L'vovich, 1979).
In turn, baseflow is about 30% of total runoff, i.e., baseflow is
|
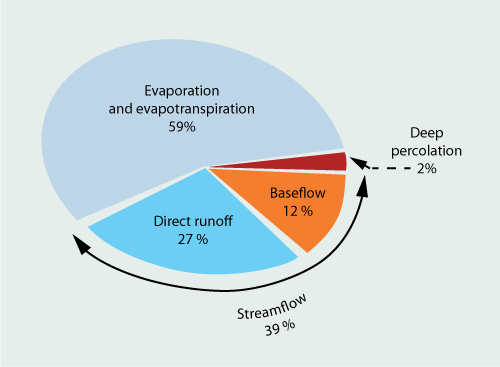
The values shown [in Fig. 2.4] are global average values. In general, a semiarid/arid region such as San Diego County has higher values of evaporation and evapotranspiration, while having correspondingly lower values of direct runoff, baseflow, and deep percolation. In arid regions, direct runoff is substantially reduced and baseflow may be reduced to zero. Conversely, subhumid and humid regions have lower values of evaporation and evapotranspiration, and higher values of direct runoff, baseflow, and deep percolation.
2.4 Groundwater recharge
Characteristically missing from this holistic view of the hydrological cycle is the concept of groundwater recharge. Within a control volume, groundwater recharge is the inflow of groundwater originating in precipitation from local and regional sources.6 A related concept is that of groundwater discharge, i.e., the outflow of groundwater within the control volume. Strictly speaking, under equilibrium conditions, net groundwater recharge is zero, that is, recharge is equal to discharge (Theis, 1940).7 Under natural conditions, mean annual recharge from all sources must balance mean annual discharge through all paths.
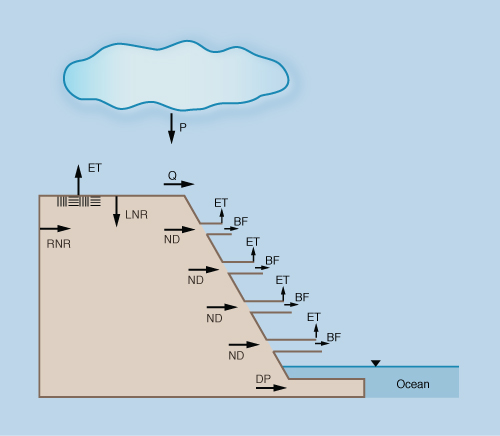
A groundwater reservoir is a leaky, porous, natural geologic container. Recharge consists of two parts (Fig. 2.5):
The fraction of precipitation that percolates vertically through the soil and reaches the water table, i.e., local natural recharge (LNR).
The recharge which originates in groundwater flow entering the control volume from upgradient sources, i.e., regional natural recharge (RNR).
The fraction of natural discharge (ND) that exfiltrates as baseflow (BF) to join the surface waters.
The fraction of natural discharge (ND) that converts to evaporation and evapotranspiration (ET).
Deep percolation (DP), which avoids the surface waters altogether.
|
Calculations of groundwater recharge are routinely performed with the aim of assessing the potential for aquifer exploitation. The accuracy of these calculations invariably hinges upon a crucial assumption: the size of the groundwater basin (Bredehoeft, 1997). All groundwaters are eventually connected in their relentless movement toward the nearest ocean; therefore, the actual size of the groundwater basin is not limited. The surface water basin may not be a reliable indicator of the extent of the groundwater resource. Nevertheless, from a practical standpoint, typical hydrogeological studies refer to the areal size of a groundwater basin as reflecting the areal size of the overlying surface water basin.
The Thompson Creek drainage area is 1,885 acres.
Including in the control volume the portion of Sycamore Creek lying downstream of
the confluence with Thompson Creek (808 acres),
the drainage area amounts to 2,693 acres. For comparison,
the Don Howard hydrological study considered a sub-basin that included all Thompson Creek plus
a sizable percentage (45%) of Sycamore Creek, amounting to a total of 2,804 acres,
(Don Howard Engineering, 2000).8
These values are summarized in Table 2.3.
| Table 2.3 Comparison of size of the groundwater basin | |
| Sub-basin | Area (acres) |
| 1. Thompson Creek | 1,885 |
| 2. Thompson Creek plus portion of Sycamore Creek downstream of Thompson Creek | 2,693 |
| 3. Thompson Creek plus 45% of Sycamore Creek (Don Howard Engineering, 2000) | 2,804 |
Notwithstanding the fact that net groundwater recharge is effectively zero, a common practice in hydrogeology is to equate the calculated recharge to the "safe yield" of a groundwater reservoir. This practice has been referred to as the "water budget myth" (Bredehoeft, 1997). Normally, the recharge becomes discharge, unless it is captured by pumping. Within a control volume, capture comes from locally increased recharge and locally decreased discharge and, in the case of depletion, from losses of storage (Theis, 1940; Ponce, 2007).
While net recharge is effectively zero, a long-standing practice has been to evaluate aquifer recharge to use as a basis for groundwater exploitation (Don Howard Engineering, 2000). Values of aquifer recharge (or groundwater recharge) vary widely, being lower for arid regions and higher for humid regions. Actual values of recharge usually exceed baseflow, because a certain amount of recharge must eventually return to the atmosphere as the evapotranspiration of riparian and wetland ecosystems. An average global value of recharge is estimated at approximately 20% of precipitation, to include:
- 12% baseflow,
- 6% evapotranspiration of riparian and wetland ecosystems, and
- 2% deep percolation (BF, ET, and DP in Fig. 2.5, respectively).
In practice, actual values of evaporation and evapotranspiration, direct runoff, baseflow, deep percolation and, consequently, recharge, are likely to vary with local and regional climatological, geomorphological, and geohydrological conditions. Baseflow and recharge decrease with mean annual precipitation, in both absolute and relative terms. Therefore, lower values of baseflow and recharge are to be expected in semiarid and arid regions.
2.5 Thompson Creek water balance
All groundwaters are eventually connected; therefore, the choice of the size of a groundwater basin for purposes of recharge calculations is largely arbitrary (Bredehoeft, 1997). The more intensive and deeper the pumping, the greater the contributing area. For purposes of this study, the contributing area is chosen as Thompson Creek and the downstream portion of Sycamore Creek, beginning at its confluence with Thompson Creek, amounting to 2,693 acres. The mean annual precipitation is estimated at 13 inches, i.e., 1.08 feet (Section 2.2).
Groundwater recharge is usually expressed as a percentage of precipitation. An average global value of recharge is 20%, applicable to the middle of the climatic spectrum, with 33 inches of precipitation (Ponce et al., 2000). In semiarid San Diego County, with approximately 10 to 15 inches of precipitation, the recharge percentage is, in all probability, much smaller.
For instance, Scanlon et al. (2006) have performed a global synthesis of groundwater recharge in semiarid and arid regions, using approximately 140 study areas, including the U.S. Southwest. They report values of recharge varying between 0.1% and 5.0% of mean annual precipitation. These values notwithstanding, Don Howard Engineering (2000) performed a calculation of groundwater recharge in their Sycamore Creek sub-basin, considering a contributing area of 2,804 acres and 14.81 in (1.23 ft) of mean annual precipitation. The mean annual recharge calculated by Howard is 323.5 acre-feet, which amounts to 9.4% of mean annual precipitation, as shown here:
Recharge-to-precipitation percentage = 100 × [ 323.5 acre-feet / (2,804 acres × 1.23 feet) ] = 9.4%.
While the Scanlon et al. (2006) data is compelling due to the large number of study areas, the semiarid [Mediterranean] ecosystem of Thompson Creek may actually have a somewhat higher recharge-to-precipitation percentage. This is due to the rainy season being out of phase with the summer season, when evapotranspiration is at its peak.
For the present analysis, three values of recharge-to-precipitation percentage are initially considered, for purposes of comparison:
- 5.0%, the upper limit of the Scanlon et al. (2006) data;
- 7.2%, an average of the upper limit of the Scanlon et al. (2006) data and Howard's data; and
- 9.4%, the value calculated by Howard (Don Howard Engineering, 2000).
The calculated mean annual recharge under the 5.0% assumption is:
2,693 acres × (5.0/100) × (13/12) = 146 acre-feet.
The calculated mean annual recharge under the 7.2% assumption is:
2,693 acres × (7.2/100) × (13/12) = 210 acre-feet.
The calculated mean annual recharge under the 9.4% assumption is:
2,693 acres × (9.4/100) × (13/12) = 274 acre-feet.
Groundwater capture in the basin is shared between Maderas Golf Club, Heritage Estates, Old Coach Estates, and a few other homes. The number of households using groundwater is estimated to be about 60.9 The individual household well use is estimated to be approximately 1 acre-feet/year on the average (Don Howard Engineering, 2000). This amounts to 60 acre-feet/year.
Maderas Golf Club has been authorized to use 150 acre-feet/year; the maximum allowed is 280 acre-feet/year. In the past 12 years (2000-2011), Maderas has pumped an average of 164 acre-feet/year (SCS Engineers, 2010; 2012). Thus, the total groundwater capture averages: 60 + 164 = 224 acre-feet/year.
The average capture-to-recharge percentage is:
For the 5.0% recharge: (224/146) × 100 = 153%.
For the 7.2% recharge: (224/210) × 100 = 107%.
For the 9.4% recharge: (224/274) × 100 = 82%.
These values are summarized in Table 2.4.
| Table 2.4 Capture-to-recharge percentage in the Thompson Creek area | ||
| Recharge-to-precipitation
(%) | Mean annual recharge (acre-feet) | Capture-to-recharge (%) |
| 5.0 | 146 | 153 |
| 7.2 | 210 | 107 |
| 9.4 | 274 | 82 |
2.6 Thompson Creek capture-to-recharge
The overriding question is what value of capture, in percentage of recharge, is appropriate for sustainability (Section 8). The answer is by no means straightforward. Use of 100% or more of the recharge has been widely discredited (Sophocleous, 1997; Bredehoeft, 1997; Alley et al., 1999 [1]; Maimone, 2004). Capture of the entire recharge encroaches upon established rights in the short term (local water table depletion) and long term (decreases in evaporative losses downstream, and eventually, flow reversals from neighboring basins); see, for example, Prudic and Herman (1996).
|
United States Groundwater Data
To provide a national measure of comparison, the average capture-to-recharge percentage for the continental United States is calculated here. The pumpage of fresh groundwater in the United States has been estimated as 77,500 million gallons per day (Solley et al., 1998). Moreover, the natural recharge to the Nation's groundwater systems has been estimated at more than 1 billion acre-feet per year. The latter amounts to 892,000 million gallons per day (Nace, 1960). Thus, the average capture-to-recharge percentage in the United States is approximately 8.7% (Alley et al., 1999 [2]). The surface area of the entire United States is 3,794,100 square miles and the mean annual precipitation is 30.21 inches. Therefore, the volume of mean annual precipitation is: P = 3,794,100 square miles × 640 acres/square mile × (30.21/12) ft = 6.113 billion acre-feet. Thus, the spatially averaged recharge-to-precipitation percentage in the United States is: = (1.000/6.113) × 100 = 16.36%. |
For Thompson Creek, with a Mediterranean climate and mean annual precipitation of 13 inches, the actual recharge-to-precipitation percentage may be higher than the upper limit of the Scanlon (2006) data (5%). An estimate is obtained by a proportional relation from the U.S. data: (13/30.21) × 16.36% = 7.04%.
Thus, the recharge is: 2,693 acres × (7.04/100) × (13/12) = 205 acre-feet.
The capture-to-recharge percentage is: (224/205) × 100 = 109%.
This calculation shows that the amount of groundwater capture
at Thompson Creek and environs in the past twelve years [2000-2011]
has been higher than the gross recharge.
The comparison of groundwater use between the continental United States and Thompson Creek is summarized in Table 2.5.
| Table 2.5 Comparison of groundwater use in Thompson Creek and the United States | ||||
| Basin | Mean annual precipitation (inches) |
Recharge-to-precipitation
(%) |
Capture-to-recharge (%) |
Capture-to-precipitation (%) |
| Continental United States | 30.21 | 16.36 | 8.7 | 1.4 |
| Thompson Creek | 13.0 | 7.04 | 109 | 7.7 |
Maderas has been authorized to pump up to a maximum of 280 acre-feet/year.
Table 2.6 shows the Thompson Creek capture-to-recharge percentage if Maderas accomplishes
the pumping of this amount of groundwater.
Thus,
the capture-to-recharge percentage for Thompson Creek varies from 109% for the 2000-2011 historical record,
to 166% for the currently allowed maximum.
| Table 2.6
Comparison of capture-to-recharge percentages in Thompson Creek for recharge-to-precipitation estimate of 7.04% | |||
| Description | Maderas Volume (acre-feet/year) | Total volume (Maderas plus households) (acre-feet/year) | Capture-to-recharge (%) |
| Historical average for the period 2000-2011 | 164 | 224 | 109 |
| Maximum allowed | 280 | 340 | 166 |
3. GROUNDWATER
3.1 Geohydrology
Thompson Creek is underlain by the Peninsular Range Batholith, which straddles the mountains of Central Southern California. At Thompson Creek, this Cretaceous geologic formation features granitic rock of two types (U. S. Geological Survey, 1999): 10
To the north and northwest, Green Valley tonalite, characterized as medium-grained gray tonalite, with minor granodiorite, gabbro, and other basic igneous rocks.11
To the south and southeast, Woodson Mountain granodiorite, characterized as coarse-grained light-colored granodiorite with some finer-grained granodiorites and minor tonalite.
The rocks are extensively fractured,
due primarily to batholith cooling (Segall et al., 1990).
The fractured rock aquifer is heterogeneous and anisotropic, i.e., its physical properties vary with location and direction.
This means that the groundwater flow will often not be in the same direction
as the hydraulic gradient.
In principle, the flow direction in fractured rock aquifers can differ from the direction of the prevailing
hydraulic gradient by up to 90o (Love et al., 2001).
Where there is a strong preferred orientation of fractures, the drawdown cone can be distorted from the concentric shape
normally observed in alluvial aquifers.
Therefore, the preferred flow path in a fractured rock aquifer defies conventional geohydrological characterization.
|
3.2 Flow in a fractured rock aquifer
Flow in a fractured rock aquifer is quite distinct from that of an alluvial aquifer. The volume of water in storage is likely to range from 1/100 to 1/1000 of a comparable alluvial aquifer. Furthermore, a fractured rock aquifer is essentially anisotropic, i.e., its properties vary with direction. Thus, aquifer connectivity is a major issue in a fractured rock aquifer. Furthermore, fractured rock aquifers tend to be dominated by advection, while diffusion is generally the predominant mechanism in alluvial aquifers.12
Advection is a first-order process, governed by the advective term in the differential equation of fluid motion; diffusion is a second-order process, governed by the diffusive term.13 Flow in porous media is primarily governed by diffusion, and this is generally the case for typical alluvial aquifers. However, flow in fractured rock aquifers is primarily governed by advection.
In fluid mechanics, as well as in groundwater flow, the difference between advection and diffusion is largely one of scale. In practice, an advection-dominated groundwater flow will feature large changes in geohydrological properties, including flow rates and directions, within short distances. The opposite, small changes over long distances, prevails in diffusion-dominated flows.
In general, an advection-dominated process is much faster than its diffusion-dominated counterpart, and the flow path and pumping rates are much less predictable. In practice, fractured rock aquifers will deplete faster, and recharge faster, than their alluvial counterparts. Lack of hydraulic connection between two neighboring wells could be common in fractured rock aquifers.
3.3 Storage in a fractured rock aquifer
Storage in a fractured rock aquifer occurs primarily in the fractures. Although the rock matrix has significant porosity, its permeability is commonly so low that flow in the matrix is small relative to the flow in the fracture networks. When test or production wells in these fractured materials are sampled, the samples represent water flowing in the fracture system rather than water present in the rock matrix (Freeze and Cherry, 1979).
The storage capacity of a fractured rock aquifer depends on the extent of fractures, being considerably less than the storage capacity of alluvial aquifers of comparable size. The storage coefficient for the Thompson Creek fractured rock was measured by Don Howard Engineering at S = 0.0003 (Don Howard Engineering, 2000). Howard assumed a thickness of 850 ft of bedrock, and proceeded to calculate a basinwide storage capacity of 866 acre-feet, of which the great majority (82%) corresponded to the fractured rock aquifer, with the remainder accounted for by patches of alluvium (S = 0.30) and decomposed rock (S = 0.03).
Assuming that capture came from storage only, this finding means that the capture of 866 acre-feet on an average-rainfall year would lower the average depth to the water table by about 850 feet. However, capture typically also comes from increased recharge and decreased discharge (Ponce, 2007). The relative contributions of storage, recharge, and discharge may not be readily ascertained in a fractured rock aquifer.
3.4 Groundwater capture in Thompson Creek
Groundwater capture has occurred in Thompson Creek and environs since the beginning of contemporary settlement, c. 1900. The presence of an old, relatively shallow hand-dug well, which is currently out of commission, attests to the fact that the early settlers used groundwater to satisfy their needs.14 Thus, prior to extensive groundwater development in the 1990s, the depth to the water table in some places may have been less than 20 ft.
The community of Old Coach Estates owes its name to the old stagecoach station that existed near the intersection of Thompson Creek with Sycamore Creek. The stagecoach ceased operation in 1912.15 The stagecoach station foundation survived until the 1990s, when it finally gave way to urban development.16
The earliest contemporary well in the present-day Old Coach Estates dates back to 1973, when
the well on the Bithell property was drilled to a depth of 250 ft.
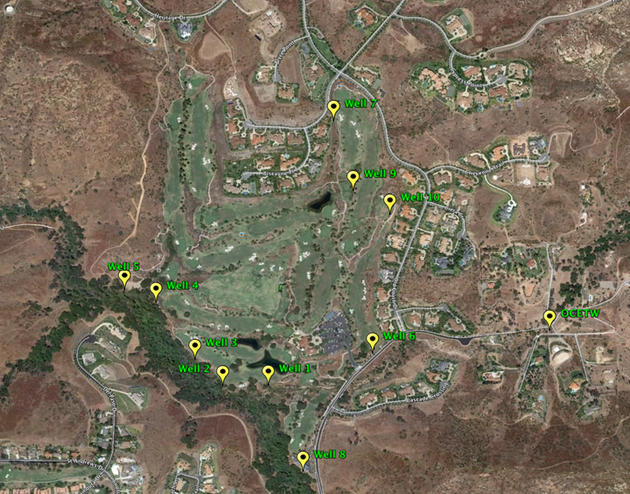
There are currently about 60 wells in Thompson Creek and environs,
using a total of about 60 acre-feet/year. In addition,
Maderas Golf Club operates ten (10) production wells,
with a combined annual capture fluctuating widely (Fig. 3.2).
Between the water years 2000 to 2011,
the average capture by Maderas wells was 164 acre-feet/year (SCS Engineers, 2010; 2012).
Maderas groundwater capture is summarized in Table 3.1.
| Table 3.1 Groundwater capture by Maderas Golf Club | |
| Time period | Capture (acre-feet/year) |
| Authorized by Conditional Use Permit (CUP) | 150 |
| 12-year period 2000-2011 | 164 |
| Maximum allowed by the CUP | 280 |
|
|
The Old Coach Estates Test Well [OCETW]
The Old Coach Estates Test Well [OCETW] is used by the City of Poway as a way of monitoring the groundwater depletion in the basin, in order to regulate the amount of pumping, if necessary. The Conditional Use Permit (CUP) stipulates that if the water level drops below 180 feet from ground surface, all pumping by Maderas should stop until the water level is restored to 40 feet above the threshold (i.e., to 140 feet).1 Yet on October 12, 2009, on the advice of a consultant, the City of Poway allowed pumping by Maderas to continue even though the OCETW had not yet restored to the 140 feet level.17 On August 11, 2011, acting on the recent escalated concern from residents over the level of water in their wells, the City of Poway directed Maderas to cease the use of all groundwater by August 18, 2011. 18 On March 6, 2012, Maderas reported the water level at OCETW at 227 feet below ground surface, well below the 140 feet level at which pumping can be restored. The OCETW measurement by Maderas is compared with measurements performed by Gill and Vaplon, Old Coach Estates homeowners (See Section 7), who report the well to be dry, for the most part, at the present time [April 2012]. The original depth of the well, dating back to 1975, was about 244 feet.19 |
3.5 Sustainable yield
In the period 2000-2011 Maderas Golf Club has captured an average of 164 acre-feet/year of groundwater. The existing households in Thompson Creek and vicinity are estimated to use a combined volume of about 60 acre-feet/year. Thus, groundwater capture in the basin in the 12-year period has been about (164 + 60) = 224 acre-feet/year on the average. In addition, Maderas has placed on the record its intention to request an amendment to the CUP to modify or eliminate the conditions relating to limitations on pumping.3
In this situation, Maderas could theoretically increase its capture beyond the current 280 acre-feet/year limit. The total water consumption by Maderas is 450 acre-feet/year, with a portion of it satisfied by precipitation. On an average year, it is likely that about 22% of the consumptive use is satisfied by precipitation.20 Therefore, if the limitations on pumping are removed, Maderas could capture groundwater as needed, up to an amount equal to:
(1 - 0.22) × 450 acre-feet/year = 351 acre-ft
in an average year.
The recharge to groundwater is estimated to be 205 acre-feet/year, based on an estimated recharge-to-precipitation percentage of 7.04% (Section 2.5). Capture of the entire recharge, or more, with the intent to make maximum use of the available groundwater, has been widely discredited (Bredehoeft, 1997).
Alley et al. (1999) [3] have argued convincingly that the concept of safe yield is outdated, and that it must now be replaced by the concept of sustainable yield. Sustainable yield has almost nothing to do with recharge; therefore, a sustainable socioeconomic yield must be based on the concept of sharing a limited natural resource held in common. Maimone (2004) has stated that sustainable yield is indeed a moving target, to be determined after a judicious evaluation of all factors, including hydrological, geohydrological, ecohydrological, and socioeconomic. In practice, this means that the amount of groundwater capture that Maderas can accomplish is limited by the effect that this capture may have on its neighbors' wells.
Barring the use of 100% of the recharge,
the determination of a sustainable yield must be
approached with caution.
In the present case, the appropriate capture-to-recharge percentage must be based on a judicious
evaluation of the long-term effect of a given value on the neighbors' wells.
Table 3.2 provides a framework for analysis.
| Table 3.2
Groundwater yield as a function of capture-to-recharge percentage in Thompson Creek, for recharge of 205 acre-feet/year | ||
| Capture-to-recharge (%) | Groundwater yield (acre-feet/year) | |
| 10 | 21 | |
| 20 | 41 | |
| 30 | 62 | |
The persistent lowering of the water table at Thompson Creek and vicinity has shown that capture is being accomplished largely at the expense of aquifer depletion. Current data shows that the total groundwater capture will supply the equivalent of about 224 households (Table 2.6). To put these figures in the proper perspective, it is observed that in 1976, during initial development of the area, the County of San Diego had estimated that there were enough groundwater resources to support only 35 homes, and that any substantial increase would cause serious problems resulting from excessive groundwater extraction.21
4. EVAPOTRANSPIRATION
|
|
4.1 Evapotranspiration
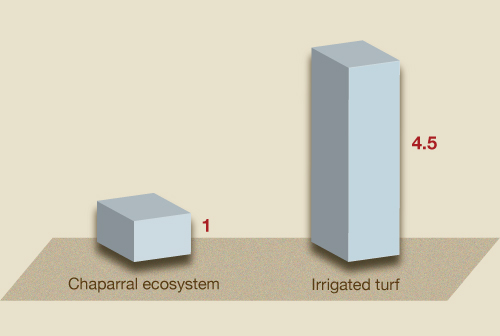
The water needs of an artificial turf ecosystem such as that being used in Thompson Creek and environs [by Maderas and others] are compared with those of the region's natural ecosystem, that is, the chaparral. The analysis focuses on evapotranspiration.
|
Potential vs actual evapotranspiration
Evapotranspiration (ET) is the amount of water consumed by an ecosystem, expressed in inches per month, and summed up through the year to obtain an annual value. Potential evapotranspiration (PET) is the amount that would be consumed under the assumption of an ample supply of water at all times. Actual evapotranspiration (AET) is the amount that would take place when water is limiting, that is, when there is not enough water to satisfy all the needs of the plants. Reference crop evapotranspiration (ETo) is the potential evapotranspiration of an extended surface of 8-15 mm tall green grass cover of uniform height, actively growing, completely shading the ground, and not short of water. The relation between potential evapotranspiration and actual evapotranspiration characterizes the water balance in ecosystems (Ponce, 1989). |
In humid regions, potential evapotranspiration is usually satisfied and, therefore, actual evapotranspiration is the same as potential evapotranspiration. Conversely, in arid regions, potential evapotranspiration is not satisfied and, thus, actual evapotranspiration is always less than potential evapotranspiration. Irrigation strives to meet the requirements of potential evapotranspiration in an environment where water is limiting. Thus, irrigation amounts to a subsidy, that is, the provision of an additional amount of water to fill in the gap between actual and potential evapotranspiration.
With reference to Thompson Canyon, the natural condition is the actual evapotranspiration of the chaparral ecosystem; the artificial condition is the potential evapotranspiration of the warm-season Bermuda grass used as turf. The ratio of artificial PET to natural AET is an indication of the artificial water demand, that is, of the extent to which the artificial ecosystem is affecting the groundwater sustainability of the region.
4.2 Evapotranspiration of the natural ecosystem
The Mediterranean ecosystem, characterized by chaparral, is prevalent in Southern California. The potential evapotranspiration of the chaparral is 35 inches (Hibbert, 1979). Yet, the chaparral is conditioned to survive and get by with a much lesser amount of water. In Thompson Creek, mean annual runoff is estimated at 1 inch, i.e., 8% of rainfall.22
Q = 0.08 × P = 0.08 × 13 = 1 inch.
Mean annual actual evapotranspiration is equal to mean annual precipitation minus mean annual runoff:
AET= P - Q = 13 - 1 = 12 inches.
Note that in Thompson Creek, AET (12 inches) is only about a third of PET (35 inches).
4.3 Evapotranspiration of the artificial ecosystem
The potential evapotranspiration of the artificial ecosystem is based on the reference crop.
The reference-crop potential evapotranspiration ETo for San Diego County was obtained from
"Reference Evapotranspiration Zones" of the California Irrigation Management Information System (CIMIS) (California Department of Water Resources, 2010).
In this study, San Diego County is labeled as Zone 16,
with monthly ETo as shown in Table 4.1. Annual ETo is equal to
The turf being used in Thompson Canyon by Maderas is warm-season Bermuda grass. The crop coefficients Kc for this type of grass are shown in Table 4.1 (University of Arizona, 2000).
The potential evapotranspiration is calculated as:
ETc = Kc × ETo
Values of ETc are shown in Table 4.1.
Annual ETc is equal to
Table 4.1 Monthly ETo
for San Diego County and ETc for warm-season Bermuda grass
|
| Jan
| Feb
| Mar
| Apr
| May
| Jun
| Jul
| Aug
| Sep
| Oct
| Nov
| Dec
| Annual
| ETo (in)
| 1.55
| 2.52
| 4.03
| 5.70
| 7.75
| 8.70
| 9.30
| 8.37
| 6.30
| 4.34
| 2.40
| 1.55
| 62.5
| Kc
| 0.86
| 0.82
| 0.83
| 0.86
| 0.83
| 0.81
| 0.89
| 0.92
| 0.87
| 0.91
| 0.95
| 0.90
| -
| ETc (in)
| 1.33
| 2.07
| 3.34
| 4.90
| 6.43
| 7.05
| 8.28
| 7.70
| 5.48
| 3.95
| 2.28
| 1.40
| 54.2
| | |||||||||||||
|
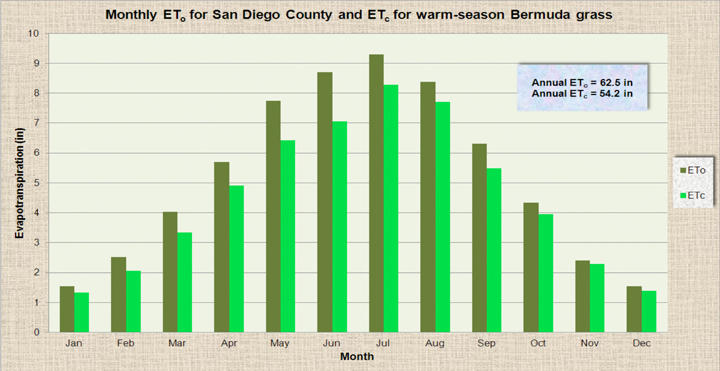
In summary, the annual ETc
for Bermuda grass is 54.2 in (PET), while the annual actual evapotranspiration (AET) for the chaparral
ecosystem is 12 inches.
Thus, the ratio of potential evapotranspiration
of the artificial ecosystem to actual evapotranspiration of the natural ecosystem is:
|
5. ECOHYDROLOGY
5.1 Riparian ecosystem health
Riparian ecosystems23 are ecosystems sustained by vadose-zone moisture24 and groundwater in the immediate vicinity of creeks and streams. In its quest to get to the nearest ocean by taking the path of least resistance, groundwater flows toward surface depressions created by surface water. There, it is typically shallow enough to be within reach of the roots of riparian ecosystems.
Depletion of groundwater threatens the health of riparian ecosystems. Typically, groundwater pumping deepens the water table in the vicinity (Theis, 1940). Depending on the amount of capture and on the local geomorphology, pumping may depress the water table in an adjacent riparian zone, reducing the ecosystem's ability to tap groundwater. In this case, the riparian communities become first, water-stressed and, eventually, if the condition persists for a sufficiently long time, they decline and eventually die.
There are many
examples of the demise of riparian vegetation as a direct consequence
of groundwater depletion.
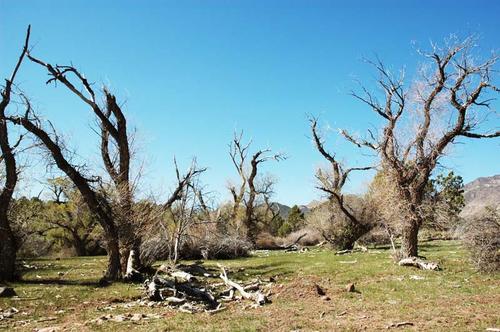
One recent case study, that of Sawyer Spring and Ash Creek, in Southwestern Utah, is described below.
|
THE CASE OF SAWYER SPRING AND ASH CREEK
Sawyer Spring and Ash Creek are located near New Harmony, in Southwestern Utah. These streams drain a shallow alluvial aquifer and the fractured bedrock aquifer of the Pine Valley Mountains to the west, which peak at 10,350 ft. In 1997, a nearby well was pumped at the rate of 1,700 gpm, for 24 hours a day, 7 days a week. Drawdown from this capture eliminated the surface flow in Sawyer Spring and greatly diminished that of Ash Creek. Riparian vegetation along Sawyer Spring and Ash Creek were adversely affected by the lowering of the water table. Many trees either died or were substantially impaired in their normal growth and development (Fig. 5.1). In October 2007, pumping was stopped by mutual agreement in order to observe changes in groundwater levels and corresponding spring flow. Baseflow has since recovered in Sawyer Spring and Ash Creek (Ponce and Player, 2008).
|
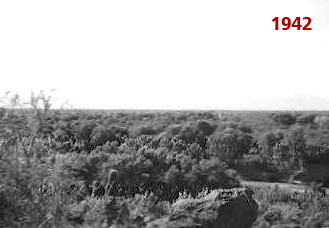
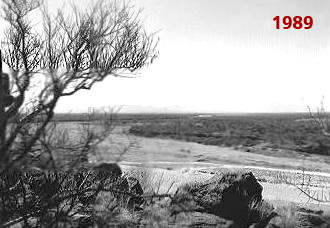
A classic example of groundwater depletion and its effect on riparian ecosystems is that of the Santa Cruz River, in south-central Arizona. Groundwater pumping to support the city of Tucson and vicinity has resulted in water table drops of several hundred feet, coupled with significant losses of riparian vegetation (Webb et al., 2007).
Figure 5.2 shows two views of the same reach of the Santa Cruz River at Martinez Hill, south of Tucson (Webb and Leaky, 2006). The left photo, dated 1942, shows well established stands of mesquite and cottonwood trees along the river banks, indicating that sufficient moisture to support vegetation existed in the soil at that time. The photo to the right, taken in 1989, shows that the riparian trees have disappeared. Data from two nearby wells indicates that the water table had declined more than 100 feet due to pumping. The roots of mesquite on the flood plain of the Santa Cruz River have been known to reach depths of 50 to 60 feet (Meinzer, 1927).
|
|
| Robert H. Webb, U.S. Geological Survey |
Note the huge rock near the center foreground appearing in both photos.
The Sawyer Spring/Ash Creek experience and the Martinez Hill paired photographs shown above are but two examples that demonstrate the relation between groundwater depletion and loss of riparian ecosystems. Groundwater depletion can also threaten other wetland ecosystems. The case of the Ojos Negros valley, in Baja California, Mexico, is a good example of the effects of groundwater depletion (Ojos Negros Research Group, 2003).
5.2 Riparian health in Lower Thompson Creek
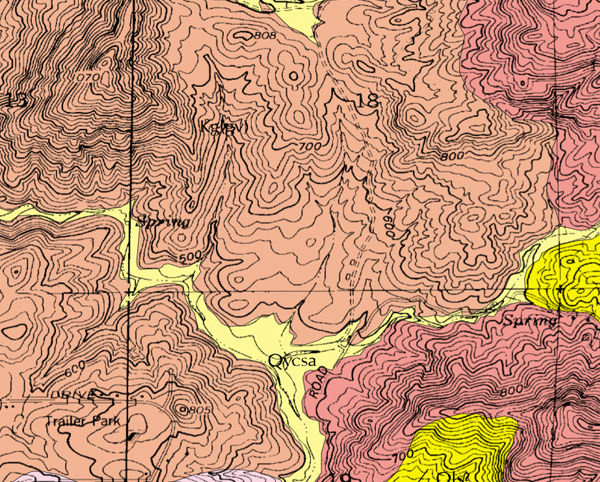
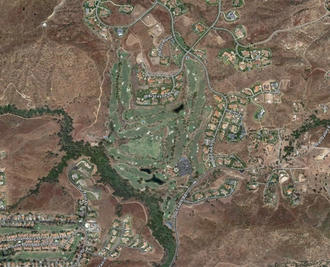
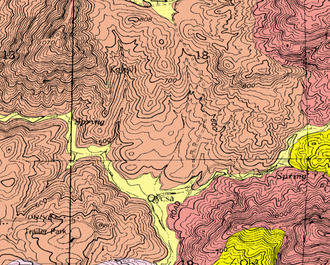
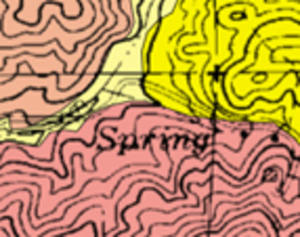
Riparian vegetation health in Lower Thompson Creek may have already been compromised. The geologic map of Thompson Creek and vicinity shows the existence of an alluvial/colluvial aquifer of limited transverse extent underlying the creek and superimposed on the regional fractured rock aquifer (Fig. 3.1). The aquifer, shown as light yellow in color, is labeled Qycsa, depicting younger (Holocene) colluvial and stream deposits of silty sand with clay and gravel.25 Figure 3.1 shows that the same type of aquifer underlies Sycamore Creek. Since Thompson Creek is a tributary of Sycamore Creek (Fig. 2.1), the Thompson Creek aquifer flows into the Sycamore Creek aquifer.
While the same type of aquifer underlies both Thompson and Sycamore Creeks, their riparian health
appears to be at variance. Figure 5.3 shows a side-to-side comparison of a current
aerial view
and the
geologic map of Thompson and Sycamore Creeks and vicinity, at the same scale.
These figures show that while Sycamore Creek appears sufficiently healthy,
the same is not true for Lower Thompson Creek. Thompson Creek's riparian vegetation appears
somewhat healthy to the east, but not near its
confluence with Sycamore Creek.
The combined effect of urban development, wildland fire, and groundwater depletion
may be surmised.
|
|
| Google Earth© | U.S. Geological Survey |
Note that the geologic map of Thompson Creek (Fig. 5.3) has a clearly labeled Spring near the Myers property (Fig. 5.4).
This is clear proof that prior to 1990,
there was a spring in the vicinity. Robert Myers himself recalls that in the spring of 1980,
in the wake of three wet years [1978-1980],
his well operated under flowing artesian conditions for three to four months.26, 27
Jeanen Monteleone, a long-time Old Coach Estates resident and neighbor of Myers, recalls that back in the 1980s
there used to be plenty of tadpoles in the area, a sure indication of standing water.28
At present [April 2012], there is no evidence that the spring is there.
Therefore, the question is: "What happened to the spring?"
|
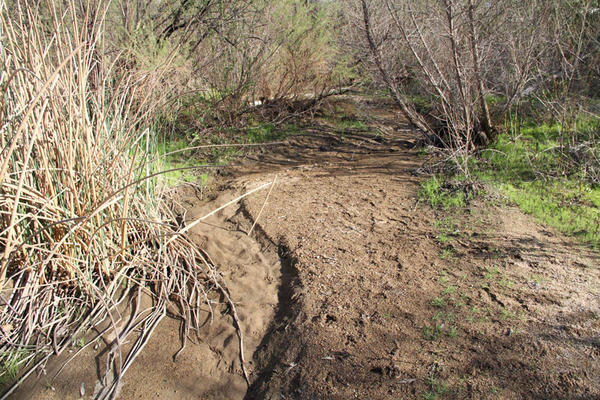
5.3 Riparian health in Upper Thompson Creek
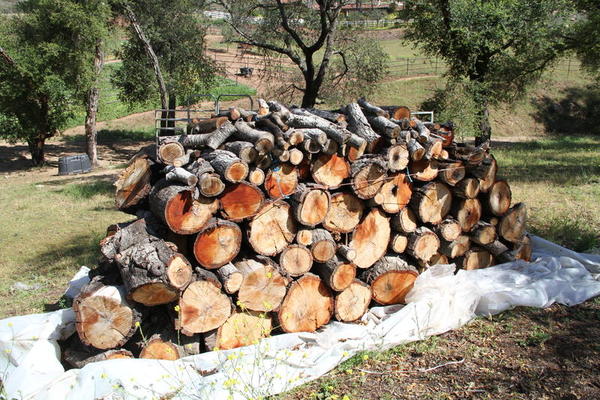
The riparian health in Upper Thompson Creek may have already been compromised by groundwater depletion. The situation is particularly acute in the Kassel property, which is the farthest upstream household in Thompson Creek. According to Paul Kassel, between June 2010 and April 2012, he lost about one tree per month.29 Overall, he has had to remove fourteen (14) dead trees, and trees are continuing to die on his property (as of April 2012). He now uses the cut wood to heat his house; for the past two years, he has not needed to buy any additional wood. Concurrently, Kassel reports poor water quality in his well (Section 7.1). The water has a burnt orange color, even though he has three filter systems.
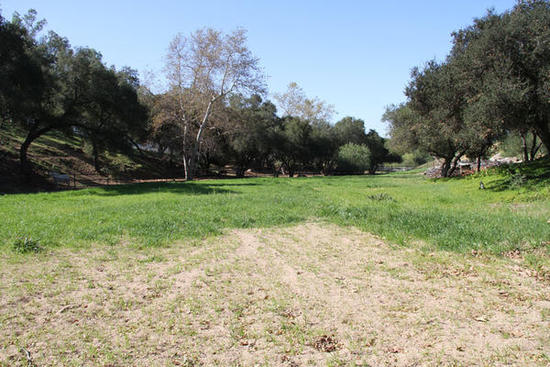
A similar situation is reported by Tom Moore, whose property is located immediately downstream of Kassel's.30 Moore reports the loss of seven (7) trees in the four-month period of June to September 2011. Ten (10) cords of cut wood originating in the recent tree die-off were produced. 31 Most of it is still piled up on the premises (Fig. 5.5). Additionally, the Moores report that Thompson Creek, which runs through their property (see Top figure), used to have a lot more water and moisture, but that in the past 15 years it has dried up considerably. This behavior is consistent with loss of baseflow due to groundwater depletion.
Detailed ecohydrological studies are needed to confirm that the tree die-off at the Kassel and Moore properties is due to groundwater depletion. In the meantime, the riparian resources at Upper Thompson Creek continue to be compromised.
|
6. SALINITY
6.1 Quality of groundwaters
All waters of the Earth contain a certain amount of dissolved solids. Water has an intrinsic tendency to pick up solids as it flows over rocks and soils from headwaters to oceans. This is due to its extremely high dielectric constant, a property that compels it to dissolve solids that originate in the rocks and soils.32 In addition, the solubility of salts in water, particularly that of sodium chloride, is extremely high.33 Thus, water not only picks up salt ions naturally, but it also has a tendency not to part with them. Once the sodium chloride salts are dissolved, it is extremely hard for them to precipitate out of the solution.
Generally, the quality of groundwaters differs from that of surface waters. Surface waters recyle every eleven (11) days on the average (L'vovich, 1979). Even when surface waters are retained in continental locations, naturally or artificially, for up to a year or more, the natural water quality remains substantially unchanged.
Unlike surface waters, groundwaters have a wide range of ages, varying from days to years to
centuries to millennia (Fig. 6.1).
The global replacement of all groundwater has been estimated at 5,000 years (L'vovich, 1979).
For depths within 2,000 m of the Earth's surface,
groundwater is replaced every 1,400 years
(World Water Balance, 1978).
Drainage conditions deteriorate with increasing depth, the movement of water slows down, and the salinity concentration increases (Chebotarev, 1955).
The deeper the groundwater, the older and saltier it is likely to be (Freeze and Cherry, 1979).
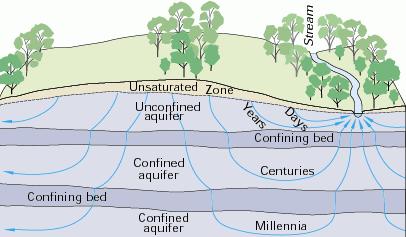 |
| U.S. Geological Survey |
| Fig. 6.1 Age of groundwaters. |
The quality of groundwater is measured by its salinity. The salinity concentration varies with the specific surface area of the soil and rock materials, the solubility of the minerals, pH, pE, and contact time (Walton, 1970).34 Other factors being equal, the salinity concentration is highest where the movement of groundwater is slowest. A typical groundwater geochemistry in the upper crust of the lithosphere is composed of the following anionic sequence (Chebotarev, 1955): 35
- Bicarbonate waters at shallow depths,
- Sulfate waters at intermediate depths, and
- Chloride waters at great depths.
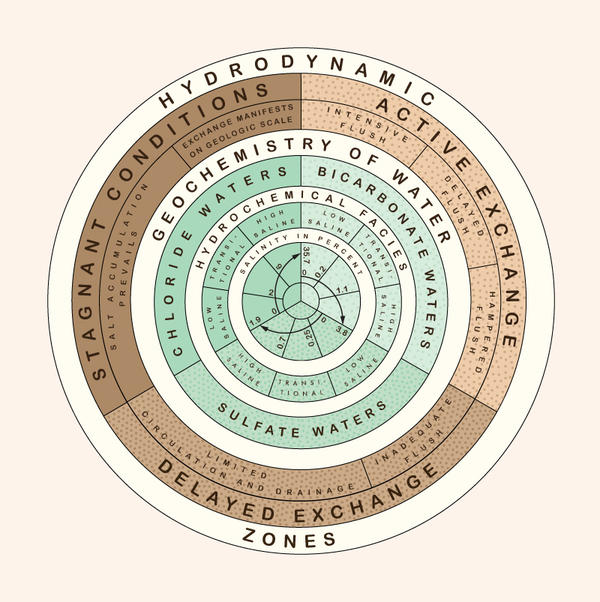 |
| Fig. 6.2 Cycle of metamorphism of groundwater quality (Chebotarev, 1955).35 |
Generally, as the groundwater becomes deeper and older, the dominant cations change from calcium and
magnesium to sodium, and the concentrations increase accordingly.36
Thus, the deeper the groundwater pumping and the greater the capture,
the greater the problem of solids disposal
(Alley, 2003 [2]).
The situation is aggravated in arid regions, where the soils are relatively unweathered and naturally have a store of salts.
Irrigation with groundwater brings water with varying amounts of salt to the surface. Once there, the salts
eventually find their way to shallow groundwaters and neighboring surface waters (Pillsbury, 1981).
Table 6.1 shows the amount
of salt generated by three typical levels of groundwater capture and salt concentration in the irrigation water.
| Table 6.1 Salts requiring disposal (lbs) | |||
| Groundwater capture (acre-feet) |
Salt concentration in the irrigation water (mg/liter) | 300 | 600 | 1200 |
| POUNDS OF SALT | |||
| 1 | 816 | 1,632 | 3,264 |
| 10 | 8,158 | 16,316 | 32,632 | 100 | 81,579 | 163,158 | 326,316 |
6.2 Irrigation and salts
Irrigation requires salt disposal. How much salt will depend on the quality of the irrigation waters, but some salt will always need to be dealt with (van Schilfgaarde, 1990). Evapotranspiration amounts to a consumptive use of water; thus, the salts brought in with the irrigation water are left behind in the soil profile. A sustainable irrigation operation must seek to remain in salt balance, i.e., within an appropriate time span, the operation must remove the salts that are brought in with the irrigation water (Pillsbury, 1981).
In arid and semiarid regions, additional salts are produced locally by the weathering and bioturbation of geologically young soils.37 The locally generated salts could amount to a substantial fraction of the total salts to be drained, depending on the salt content of the irrigation water and the amount of leaching required to keep the soil in salt balance.38 Significantly, low-salt irrigation waters leach proportionately more salt than high-salt waters, and high leaching volumes produce more salt than low leaching volumes; thus, local salts are always leached in geologically young soils (Rhoades et al., 1974). Moreover, the removal of salts by leaching and drainage creates a problem of disposal (American Society of Civil Engineers, 1990).
How can the salt-laden irrigation waters be disposed of properly? The solution to this problem in all cases and to the satisfaction of all stakeholders remains elusive. The problem can be mitigated in locations in close proximity to the ocean, as in the case of the Santa Ana River Interceptor, in Orange County (Santa Ana Watershed Project Authority, 2010), and the Calleguas Regional Salinity Management Pipeline, in Ventura County (Calleguas Municipal Water District, 2009). In other instances, a suitable repository for the agricultural wastewaters may be found far from surface or groundwater sources, as in the case of the Salton Sea, in Imperial and Riverside counties (Ponce, 2005).
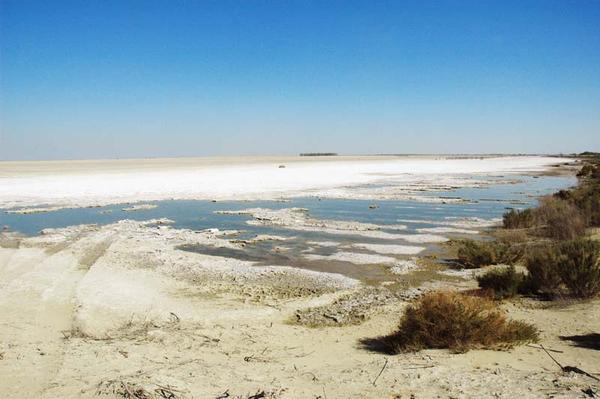
In some instances, the solution to the problem of salt disposal has been
to store the salts in evaporation ponds.
For example, several of these ponds have been implemented
in Tulare Lake Basin, in the southern Central Valley (Fig. 6.3).
As argued by Pillsbury (1981), this "solution" is counterproductive in the long run.
A soil known to be
impermeable to fresh water, when situated below an evaporation pond,
will gradually become more permeable and the saline wastewaters will eventually reach the water table,
contaminating the aquifer with unwanted salts.
|
6.3 The need for drainage
Irrigation in arid and semiarid regions always degrades water quality downstream. Without proper management, the land becomes salinized. With or without proper management, drainage waters from irrigated lands carry salt that requires disposal. Thus, on-site drainage creates a problem of off-site disposal.
On-site drainage requires the application of a leaching requirement to the soil, over and above the requirements of potential evapotranspiration. The leaching requirement is a function of the following properties (Hoffman and van Genuchten, 1983):
- The salinity of the irrigation water, and
- The salt tolerance of the crop.
The salinity of irrigation water varies typically in the range 0.5-2.0 dS/m.39 The salt tolerance of herbaceous crops varies in the range 1.5-7.5 dS/m (American Society of Civil Engineers, 1990). The leaching requirement must be applied for the system to be able to drain its salts. Depending on the local geohydrology, it may take many decades, or just a season or two, before the need for drainage becomes evident (van Schilfgaarde, 1990).
6.4 Thompson Creek salinity
In Thompson Creek, including Maderas Golf Club, the irrigation water may be assumed to have a salinity concentration of 1 dS/m, which is roughly equivalent to 600 mg/liter.40 The salt tolerance of Bermuda grass is 6.9 dS/m, a relatively high value (Mass and Hoffman, 1977). For these conditions, the leaching requirement is about 0.03, i.e., 3% of the applied water needs to drain to maintain the turf in optimum condition.
A permanent irrigation enterprise requires the sacrifice of a certain value elsewhere (van Schilfgaarde, 1990). All surface and subsurface runoff leaving Thompson Creek and vicinity flows into Sycamore Creek. In turn, Sycamore Creek flows into the San Dieguito River at Lake Hodges (Fig. 6.4).
|
At 600 mg/liter of estimated dissolved salt concentration in the irrigation water, the consumption of 100 ac-ft produces 163,158 lbs of salts, i.e., 81.6 tons (Table 6.1). Of the 450 acre-feet of water consumption by Maderas, about 78%, i.e., 351 acre-feet in an average year, is imported water plus groundwater; the remainder is satisfied by local precipitation.20 Thus, the 351 acre-feet/year of imported water plus groundwater produces a total of 286 tons of salt. Note that this estimate specifically does not include the locally generated salt, which in relatively unweathered soils could be a substantial fraction of the total salts removed with the drainage waters.38
7. SOCIOECONOMIC ASPECTS
|
|
7.1 Old Coach Estates
The community of Old Coach Estates (OCE) is located wholly within Thompson Creek. There are twenty-four (24) homeowners in OCE, listed in Table 7.1.
| Table 7.1 Old Coach Estates: Well deepening, well depth, and static level data |
For the present purpose, the homeowners are classified into three categories:
- Those who do not have a connection to city water and are, therefore, dependent on groundwater: Twelve (12) homeowners [yellow background].
- Those who use both groundwater and city water; groundwater is used for landscaping and city water for domestic use: Eleven (11) homeowners [light green background].
- Those who are using only city water: One (1) homeowner [light blue background].
Therefore, 12 out of 24 homeowners are exclusively dependent on groundwater for their livelihood. As shown in Column 5 of Table 7.1, 9 out of 24 homeowners have had to deepen their wells over the years, at significant cost to them.41 Other OCE homeowners have drilled deep wells from the start, apparently to reduce the risk of the well drying up. The deeper wells reach down as deep as 1000 to 1200 feet. For example, Jim and Ginger Kennedy have two wells at 1000-feet depth each. At 1200-feet depth, Tom and Lori Carter's well is the deepest well at Old Coach Estates.
|
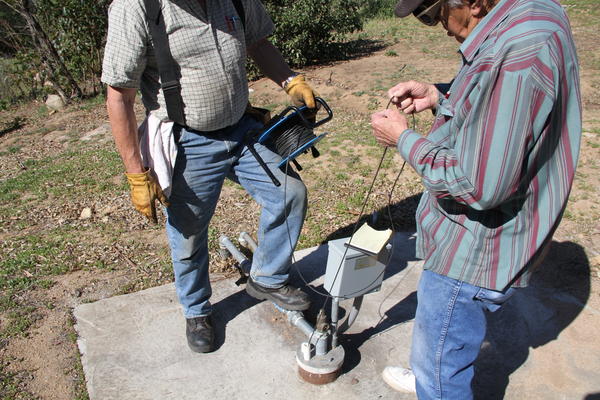
Table 7.1 shows that there is a dearth of data concerning static levels in OCE wells. There are records of static level measurements for nine (9) wells. Still, these measurements clearly show the intensity of groundwater depletion. Maximum depletion depths in the Myers, Gill, and Vaplon wells, which have the longest and most reliable record, average 275 feet, with a maximum value of 280 feet. 42
The complexity of the
flow patterns in a fractured rock aquifer such as Thompson Creek defies conventional geohydrological characterization.43
Barring
more data, the conclusion is that the aquifer has been depleted to a maximum of
280 feet, to judge by the three measured wells with the longest records.
Table 7.2 compares this amount with four (4)
classic textbook examples of groundwater depletion. It is readily seen that Thompson Creek, at 280 feet,
rates high compared to the examples shown in this table.
| Table 7.2
Case studies of groundwater depletion in the United States and other countries. | ||
| Location | Maximum depletion (feet) | Reference |
| Borrego Valley, California | 150 | Evaluation of Groundwater Conditions in Borrego Valley (2010) |
| High Plains aquifer, U.S. (Texas, Kansas, Oklahoma, and Nebraska) | > 150 | U.S. Geological Survey Circular 1186 (1999) [4] |
| Ojos Negros Valley, Baja California, Mexico | 165 | Ojos Negros Research Group (2003) |
| Las Vegas, Nevada | 300 | U.S. Geological Survey Circular 1182 (last modified 2005) |
|
Comparison with the Central Valley, California
Groundwater depletion remains a pervasive malady in California. To illustrate this point, the rate of depletion in the Central Valley, the largest agricultural region in the state, may be examined. This rate has been recently documented by Famiglietti et al. (2011). The average rate of depletion for the 6.5-year period from October 2003 to March 2010 has been measured at 31 mm/yr, i.e., a total of 201.5 mm, or 0.66 feet for the 6.5-year period. For the sake of comparison, an extrapolation to a most recent 30-year period would result in a depletion in the Central Valley of 0.66 × (30/6.5) = 3 feet. While there are large differences in scale between Thompson Creek and the Central Valley, the comparison underscores the intensity of groundwater depletion at Thompson Creek. |
Table 7.1, Column 10 shows that the water quality in the majority of the OCE wells is good, judging from homeowners' perceptions. The exception are the wells on the Kassel and Wier properties (Numbers 4 and 5). The water quality of these two wells is judged by the homeowners to be poor.
7.2 Optimum depletion level
Pumping at Thompson Creek and vicinity over the past 12 years has amounted to 224 acre-feet per year, including all users (Table 2.6). Pumping amounts to capture; capture causes loss of storage, increased recharge, and decreased discharge. Loss of storage produces aquifer depletion, i.e., the lowering of the water table below historic, pre-development levels. Maximum depletion depth in Thompson Creek has been measured at 280 ft. This value is large compared to several classic case studies of groundwater depletion (Table 7.2).
Given the perceived societal trend to use groundwater for economic reasons, the optimum depletion level cannot be readily determined solely on hydrogeological grounds. Ideally, groundwater may be pumped as much as needed, subject to the socioeconomic limitation: If local stakeholders are negatively affected, and serious concerns are expressed regarding groundwater depletion, the amount of capture would have to be reduced until the subject concerns are substantially mitigated. In the case of the Thompson Creek aquifer, it is clear that:
- There is intense competition for the groundwater resource;
- A significant number of OCE homeowners (stakeholders) have been adversely affected in the past
15 to 20 years; see Table 7.1, Column 5; and - A group of stakeholders have gone on record to express their concern regarding the depletion of the groundwater resource.
Significantly, in the past two years, in response to heightened concern, some OCE homeowners have taken upon themselves the task of performing weekly measurements of static level in several wells, in an attempt to monitor and further document the depletion.44 Eventual corrective measures would have to include a fresh assessment of sustainable yield. The following section (Section 8) reviews principles and practices of sustainable groundwater utilization.
8. SUSTAINABLE YIELD
|
|
8.1 Safe yield of groundwater
The concept of safe yield has evolved over the past one-hundred years of groundwater development. Lee (1915) defined safe yield as the limit to the quantity of water which can be withdrawn regularly and permanently without dangerous depletion of the storage reserve. He noted that water permanently extracted from an underground reservoir reduces by an equal quantity the volume of water passing from the basin by way of natural channels, i.e., the natural discharge. To illustrate the existence of this natural discharge, Lee observed that heavy pumping would commonly result in the drying up of springs and wetlands. Thus, he distinguished between a theoretical safe yield, equal to the natural recharge, and a practical safe yield, a lower value which takes into account the need to maintain a residual discharge. According to Lee, the residual discharge must be ascertained and deducted from the theoretical safe yield in order to obtain the practical safe yield.
Theis (1940), a pioneer in the field of geohydrology, recognized that some groundwater is always mined.7 This conclusion follows directly from the average life of groundwater at less than 2,000 m depth, estimated at 1,400 years (World Water Balance, 1978). Invariably, some of the mining will come from aquifer storage; thus, depletion is inherent to groundwater capture. What is at stake is not whether depletion is taking place, but how much depletion is socially and economically acceptable (Alley et al., 1999 [5]).
|
The source of water derived from wells, by C. V. Theis (1940)
"All groundwater of economic importance is in process of movement through a porous rock stratum from a place of intake or recharge to a place of disposal. Velocities of a few tens or a few hundreds of feet a year are probably those most commonly met with in aquifers not affected by wells. This movement has been going on through a part of geologic time. It is evident that on the average the rate of discharge from the aquifer [during recent geologic time] has been equal to the rate of input; therefore, pristine aquifers are in a state of dynamic equilibrium... Discharge by wells is thus a new discharge superimposed upon a previously stable system, and must be balanced by an increase in the recharge of the aquifer, or by a decrease in [the old] natural discharge, or by a loss of storage in the aquifer, or by a combination of these..." (Page 277). "All water discharged by wells is balanced by a loss of water somewhere. This loss is always to some extent and in many cases largely from storage in the aquifer. Some groundwater is always mined. ...The amount of water removed from any area is proportional to the drawdown, which in turn is proportional to the rate of pumping. Therefore, too great a concentration of pumping in any area is to be discouraged and a uniform areal distribution of development over an area where the water is shallow should be encouraged..." (Page 280). |
Kazmann (1956) argued that the concept of safe yield, when taken independently of considerations of regional hydrology, is a fallacious one, because it cannot be reconciled with the legal doctrine of appropriation. All water coming from the ground must be replaced by water coming from the land surface in order for a perennial groundwater supply to be obtained. When all surface runoff in the area overlying an aquifer has been appropriated, a perennial supply cannot be obtained from the ground without encroaching on established rights.
Prudic and Herman (1996) showed the evolving nature of capture
with long-term groundwater development.
Using the aquifer of Paradise Valley, in Humboldt County, Nevada,
as an example, they found that pumping 48% of the recharge for 300 years
produced first (1) losses in aquifer storage; then (2) reduction in evapotranspiration;
subsequently, (3) decreases
in flow discharge; and eventually, (4) sizable downstream flow reversal, i.e.,
increases in recharge coming from the neighboring downstream basin. A summary of Prudic and Herman's findings
is shown in Table 8.1.
| Table 8.1 The evolving nature of capture (%) * | ||||
|
Sources of capture, at the end of the indicated time period |
Time (years) | |||
| 1.5 | 25 | 100 | 300 | |
| 1. Loss of aquifer storage | 52.8 | 25.3 | 15.4 | 6.0 |
| 2. Reduction in evapotranspiration | 47.2 | 74.5 | 82.9 | 88.3 |
| 3. Decreased flow discharge | 0 | 0.1 | 0.8 | 1.2 |
| 4. Downstream flow reversal | 0 | 0.1 | 0.9 | 4.5 |
| All sources | 100 | 100 | 100 | 100 |
| * Prudic and Herman (1996). |
Bredehoeft (1997) called into question the practice of equating "safe yield" with recharge. Echoing Theis (1940), he stated that this practice fails to take into account the existence of natural discharge. He advocates a new sustainable groundwater development paradigm, one that would focus not on the recharge, but rather on the extent of permissible capture of the natural discharge.
Sophocleous (2000) reckoned that "safe yield" ignores the fact that, over the long term, under natural or equilibrium conditions, natural recharge is balanced by discharge from the aquifer by evapotranspiration, or by discharge into streams, springs, or seeps. Consequently, if pumping equals recharge, eventually streams, marshes and springs dry up. Continued pumping in excess of recharge may eventually deplete the aquifer. Based on the unintended consequences of the safe-yield approach, Sophocleous argued in favor of retiring the concept of safe yield.
It has now become clear that the practice of capturing 100% of the recharge is untenable. This fact has been demonstrated again and again in both theory and practice. A significant amount of capture in one location, resembling the entire gross recharge, will eventually encroach upon other established rights.
8.2 Sustainable yield
Sustainable yield follows the concept of sustainable development, which emerged in the 1980s. Sustainable development is that which meets the needs of the present without compromising the ability of future generations to meet their own needs (World Commission on Environment and Development, 1987). Implicit within this definition is the realization that natural resources could be exploited in an unsustainable fashion, i.e., in a way that future generations will find it increasingly difficult to avail themselves of similar quantities of the same resources, thus, the intergenerational ethical dilemma.
Sustainability refers to renewable natural resources; therefore, sustainability implies renewability. Groundwater is neither completely renewable nor completely nonrenewable; therefore, the question is how much groundwater pumping is sustainable. In principle, sustainable yield is that which is in agreement with sustainable development. This definition is clear; however, its practical application requires the understanding of complex interdisciplinary relationships, which have been examined only recently.
Alley et al. (1999) [6] defined groundwater sustainability as the development and use of groundwater in a manner that can be maintained for an indefinite time without causing unacceptable environmental, economic, or social consequences. The definition of "unacceptable" is largely subjective, depending on the individual situation. For instance, what may be established as an acceptable rate of groundwater withdrawal with respect to changes in groundwater level may reduce the availability of surface water, locally or regionally, to an unacceptable level. According to Alley et al. (1999) [7], the term safe yield should be used with respect to specific effects of pumping, such as water level declines or reduced streamflow. Thus, safe yield is the maximum pumpage for which the consequences are considered acceptable.
Loucks (2000) observed that the assessment of groundwater sustainability must involve professionals from other disciplines. Sustainable yield has almost nothing to do with hydrogeological recharge (Bredehoeft, 1997). Sustainability studies require a balance of the entire hydrological system, not just of the aquifer. Sustainability implies a basic change in focus from groundwater as an exploitable human resource (the "basin yield" view) to groundwater as a vital part of the complex interrelated processes governing ecosystem health and flow system stability (National Research Council, 2000).
Maimone (2004) reasoned that if sustainable yield must be all-inclusive, the idea that there exists a single, correct number representing sustainable yield must be repealed. Instead, he proposed a working definition based on the following components:
- Understand the local, subregional, and regional effects, and interactions thereof.
- Develop a comprehensive conceptual water budget, including surface water and ground water, and identify consumptive vs non-consumptive use.
- Understand the boundaries and rate of replenishment of the system.
- Understand human water needs and their changing nature.
- Consider the temporal aspects of yield, including droughts and floods.
- Consider the effects of new technology and changes in societal perceptions.
- Work with stakeholders to understand tradeoffs and develop consensus.
- Recognize the interdisciplinary nature of the impacts of groundwater utilization.
Seward et al. (2006) found serious problems with the simplistic assumption that sustainable yield should equal recharge. In many cases, sustainable yield will be considerably less than average annual recharge. Natural recharge does not determine sustainable yield; rather, the latter is determined by the amount of capture that it is permissible to abstract without causing undesirable or unacceptable consequences.
8.3 Sustainable socioeconomic yield
The repeal of the concept of safe yield and the advent of sustainable yield has forced a reassessment of the practice of groundwater hydrology. Studies now encompass the related sciences of surface-water hydrology, baseflow hydrology, ecohydrology, and related economic and social aspects, to include all areas that are affected in both the short and long term by groundwater utilization. A working compromise may be to establish a sustainable socieoeconomic yield as a judicious percentage of recharge, even though there is no physical relation between them. This percentage would have to consider all aspects: physical, chemical, biological, and socioeconomic, and would have to be established by consensus.
On a global annual basis, deep percolation and recharge are about 2% and 20% of precipitation, respectively. Therefore, deep percolation is 10% of recharge (World Water Balance, 1978; L'vovich, 1979). Since deep percolation is, for all practical purposes, lost to terrestrial ecosystems, all the deep percolation could be captured without encroachment on the natural discharge, i.e., on local or regional stakeholders. Thus, a base working value for sustainable yield could be taken as 10% of gross recharge. Higher values would require sufficient proof that there are no adverse effects on the natural discharge, or that the associated groundwater depletion is acceptable to local stakeholders.
8.4 Tragedy of the Commons
A commons is a natural resource used jointly by many individuals. The tragedy is that, in the absence of regulation, there is a tendency for the commons to be overexploited by some, resulting in its eventual ruin (Hardin, 1968). Groundwater is a good example of a commons; groundwater depletion is a good example of the tragedy.
In an unregulated commons, each individual may seek to maximimize his/her own gain by unilaterally increasing his/her use of the common resource. While the benefits typically accrue directy to the individual, the costs are invariably distributed among all users of the commons. In the case of groundwater, the benefit to the individual user could be one additional acre-foot of water consumption, while the costs, both tangible and intangible, are borne by all users sharing the commons. Thus, the benefit/cost ratio of the individual's action turns out to be extremely high.
The Tragedy of the Commons is not limited to groundwater. Many other resource pools, at all scales, local, regional, and global, are subject to the predicament. Regionally, overgrazing of the range gave Hardin the inspiration to formulate his principle. Yet groundwater depletion remains a showcase for the tragedy. History tells us that under conditions of surface-water scarcity, human societies have pursued groundwater development as if there were no connection between the two.
Groundwater differs from surface water in three important respects:
- There is a lot more groundwater than surface water.
- While surface water replenishes readily, groundwater does not.
- Pristine surface-water quality is generally socially acceptable and tends to be more or less constant in time, while pristine groundwater quality decreases with depth and age.
Estimates of groundwater volumes vis-à-vis surface water volumes are one hundred times more or higher (Ponce, 2006). Thus, one may be tempted to assume that for lack of sufficient surface water, individuals and societies alike could turn to the groundwater. The practice turns into an illusion when it is realized that while surface water replenishes every eleven (11) days on the average, groundwater does not replenish as quickly (L'vovich, 1979). Some groundwaters may take centuries, and even millennia, to replenish. Thus, the possibility exists for depletion in the short term, typically spanning up to a human lifetime. Depletion means unsustainability.
More importantly, the deeper the groundwater, the older it is, and, consequently, the higher its content of dissolved solids, among them, notably, bicarbonate, sulfate, and sodium anions. Therefore, pumping deep groundwater with the intent to use it consumptively, such as in irrigation, may result in the unintended consequence of bringing to the surface large quantities of salt, which would have to be disposed of properly (Alley, 2003). Otherwise, accumulations of salt on the surface and subsurface will eventually bring about deserts where they did not exist before (Sophocleous, 2000). This is clearly an unsustainable path, one that societies need to shun at all costs.
In summary, excessive capture of groundwater by pumping, particularly from the deeper strata, may eventually produce desertification, not so much because of the lack of water, but because of the excess of salts. Societies that seek to remain sustainable must address these issues with great caution.
9. CONCLUSIONS
9.1 Conclusions
The following conclusions are derived from this study:
Precipitation in the study area averages 13 inches per year. The minimum annual precipitation in the 55-yr period of record (1957-2011) is 4.36 inches for water year 2007; the maximum is 27.62 inches for water year 1998.
All groundwaters are eventually connected; therefore, the actual size of a groundwater basin for purposes of recharge calculations is largely arbitrary. The contributing area considered in this study consists of Thompson Creek and the downstream portion of Sycamore Creek, beginning at its confluence with Thompson Creek, amounting to 2693 acres.
Recharge varies as a function of the applicable recharge-to-precipitation percentage, which for arid and semiarid regions is normally in the range 0.1-5.0%, according to global studies (Scanlon et al., 2006). However, the Don Howard Engineering (2000) calculation estimates a recharge-to-precipitation percentage of 9.4%. A 7.04% recharge-to-precipitation percentage is assumed (Section 2.5).
The calculated mean annual recharge for Thompson Creek and vicinity is 205 acre-feet.
Over the past 12 years (2000-2011), the average groundwater capture in Thompson Creek and vicinity has been 224 acre-feet, including all users.
Over the past 12 years (2000-2011), the average capture-to-recharge percentage in Thompson Creek and vicinity has been 109%. To provide a measure of comparison, the average capture-to-recharge percentage in the continental United States is 8.7%.
Capture of 100% of the recharge or more, with the intent to make maximum use of the available groundwater, has been widely discredited. This practice encroaches upon established rights, by loss of storage, increased recharge, and decreased recharge.
A base working value for sustainable capture-to-recharge percentage may be initially taken as 10%, a value which resembles the national average (8.7%). Higher values would require that the associated groundwater depletion be acceptable to local stakeholders.
A spring near the Myers property in Old Coach Estates, documented by the U.S. Geological Survey in its 1990 geologic map of Thompson Creek and environs, is currently (2012) no longer there. Groundwater depletion may be presumed to be the most probable cause of the spring's demise.
In the past two years, the loss of 21 trees has been reported by Kassel and Moore, two homeowners in Upper Thompson Creek. Trees are continuing to die on the Kassel property with no apparent reason.
The ratio of potential evapotranspiration of the turf ecosystem to actual evapotranspiration of the chaparral ecosystem is 4.5. This means that the artificial ecosystem uses four-and-one-half times more water than the natural ecosystem.
The total groundwater capture by Maderas and its neighbors amounts to about 224 household equivalents. Yet in 1976, during initial development of the area, the County of San Diego estimated that there were enough groundwater resources to support only 35 homes.
About 70% of the total groundwater capture is currently being used consumed for irrigation of the Maderas turf. Every iota of solids associated with irrigation waters will eventually find its way downstream, flowing into Lake Hodges and polluting the regional surface waters with additional quantities of salt.
At 600 milligrams per liter of estimated dissolved salt concentration in the irrigation water, the 351 acre-feet of mean annual imported surface water plus groundwater used by Maderas turf produces more than 286 tons of salt per year. This figure does not include the locally generated salt, which, in relatively unweathered soils, could be a substantial fraction of the total salts removed with the drainage waters.
One half of the Old Coach Estates homeowners (12 out of 24) are exclusively dependent on groundwater for their livelihood. Some cannot connect to city water; others will not, due to the expense.
More than one third of the Old Coach Estates homeowners (9 out of 24) have had to deepen their wells over the years, at significant cost to them. Other homeowners have purposely drilled deep wells from the start to reduce the risk of the well drying up. The deeper wells reach down to 1200 feet.
As reported by Maderas, in March 2012 the water level at the Old Coach Estates Test Well (OCETW) was 227 feet below ground surface, which is 87 feet below the 140 feet at which pumping can be restored.1 However, measurements of OCETW by local homeowners indicate that the well may be actually dry. The fact that the well has been dry since June 2011 has been confirmed by the most recent annual hydrogeology report (SCS Engineers, 2012).
In the past 30 years, the Thompson Creek aquifer has been depleted to a maximum of 280 feet, to judge by the three measured wells with the longest and most reliable records. This depletion amount is large compared with four (4) classic textbook examples of groundwater depletion, which range from 150 to 300 feet.
9.2 Concluding remarks
Both Maderas Golf Club and its Old Coach neighbors prefer to use groundwater in lieu of surface water, simply because it is less costly. Yet the groundwater resources of Thompson Creek and environs are limited and not readily replenishable. Existing hand-dug wells indicate that the water table at Thompson Creek was higher, i.e., much closer to the surface, prior to extensive groundwater development. In the past 30 years, aquifer depletion at Thompson Creek and environs amounts to up to 280 feet in certain areas.
How can the optimum amount of depletion be determined? From a societal perspective, this amount cannot be ascertained solely on hydrogeological grounds. Historically, depletion typically increases with groundwater development until a limit is reached where the amount becomes a socioeconomic and political issue. It is clearly shown that this is generally the case across the land. Alley et al. (1999) [8] put it succinctly: "We define groundwater sustainability as development and use of groundwater in a manner that can be maintained for an indefinite time without causing unacceptable environmental, economic, or social consequences."
All groundwater originates in rainfall; therefore, the documented depletion at Thompson Creek must be due to pumping exceeding replenishment. Since Maderas is pumping close to 70% of the total, it follows that Maderas must be responsible for about two-thirds of the groundwater depletion in the basin.
For the past twelve (12) years, the average groundwater pumping at Thompson Creek and vicinity has been 224 acre-feet, which amounts to about 109% of the gross annual recharge. Given the current understanding of groundwater sustainability, this percentage is clearly not sustainable.
10. RECOMMENDATIONS
|
10.1 Recommendations The following recommendations are offered based on the findings of this study:
|
ACKNOWLEDGEMENTS
|
|
This study was made possible through the support of a group of Old Coach Estates residents. Jerry Gill and Frank Vaplon graciously shared their static level measurements for seven (7) Thompson Creek wells. Other Old Coach Estates residents shared data and other information during personal interviews conducted during the month of March 2012. Information from Maderas Golf Club and The Heritage was not readily available at the time of this writing, and was obtained mostly through third parties. Therefore, the author cannot guarantee its accuracy.
This report was peer-reviewed by four colleagues with recognized expertise in the fields of hydrology, geohydrology, and ecohydrology. Their names have been withheld by request.
ENDNOTES
1
Conditional Use Permit (CUP) 90-13M(2) approved on August 29, 2000 by the Poway City Council
established an operational plan for the use of groundwater by the Maderas Golf Course.
Conditions of the CUP approval required the creation and monitoring of two test wells--one in the Lower Sycamore Canyon (LSTW)
and the other in the Old Coad Estates (OCETW) neighborhood. Groundwater threshold levels were established for each test well.
In accordance with the CUP, if the water level drops below the designated thresholds (100 feet in the LSTW and 180 feet in the OCETW), all use of groundwater is to cease until
the water level in the test wells restores to 40 feet above the threshold levels
(Letter by Penny Riley, Poway City Manager,
to Tom Story, of Sunroad Enterprises, dated August 11, 2011).
2
In response to escalated concern from local residents over the level of water in their wells,
the City of Poway directed Maderas to cease the use of all groundwater as of August 18, 2011 (Letter by Penny Riley, Poway City Manager,
to Tom Story, of Sunroad Enterprise, dated August 11, 2011).
3
Concerned Old Coach homeowners are particularly troubled by the following statement in the
August 11, 2011 letter from Penny Riley, Poway City Manager, to Tom Story, of Sunroad Enterprises:
"This letter also contemplated that Sunroad would process an amendment to the CUP to modify or eliminate
the conditions relating to limitations on pumping." (Bolding is the author's).
4 Letter from William O'Brien, General Manager,
Maderas Golf Club, to Pam D. Moore, dated May 23, 2011.
5
The Poway Valley NWS Station CA047111 is located at Latitude 32o 57' N and Longitude 117o 04' W.
The value for water year 1995, missing from the record, was taken from the Howard Engineering report (Don Howard Engineering, 2000).
6
In fluid mechanics, a control volume is a mathematical abstraction employed in the process of creating mathematical models of physical processes.
In a fixed frame of reference, a control volume is a volume in space through which discharges and velocities flow (Wikipedia).
7
Charles Vernon Theis (1900-1987), a renowned American civil engineer and hydrogeologist, pioneered the development of mathematical
expressions to determine the characteristics
of an aquifer and predict how water levels in the aquifer change during pumping.
8
The Don Howard Engineering hydrological study, in its Chapter 2 "Hydrogeologic Study," section entitled "Groundwater Recharge and Storage,"
states the following (page 2-14): "Groundwater recharge and storage are calculated for
a local drainage area that underlies Maderas Golf Club and the lower Sycamore Creek homes, and extends east
along Thompson Creek into Old Coach Estates. The drainage area boundaries used for these analyses
are presented in Plate 2. The recharge area measures
2,804 acres, including the 205-acre Maderas Club" (sic).
9
The number of Heritage households that are using groundwater was not readily available at the time of this writing.
Therefore, the number used in this report for the total household use (60) is an approximation, based on the best information available.
Thus, its accuracy cannot be guaranteed.
10
The Cretaceous is a geologic period and system ranging from circa 145.5 to 65.5 millions of years ago (Wikipedia).
11
Tonalites and granodiorites are similar in mineral composition. A tonalite is a plutonic (intrusive) rock where the
percentage of plagioclase feldspar, relative to the combined content of alkali and plagioclase feldspars,
is greater than 90; in a granodiorite, the percentage varies between 65 and 90 (American Geological Institute, 1997).
12
Advection is the transport mechanism of a conservative substance or property by a fluid, due to the fluid's bulk motion.
Diffusion describes the spreading of particles from regions or higher concentration
to regions of lower concentration (Wikipedia).
13
The terms consist of constant or variable coefficients and partial differential terms; for instance, the advective term
[u ∂h/∂x], in which u is the advective velocity;
likewise, the diffusive term [ν ∂h2/∂x2],
in which ν is the diffusivity coefficient.
14
The existing handdug well at the Owens property [Justin and Jessica Owens] at 18201 Old Coach Road
is 4 feet diameter and 18 feet deep (Jessica Owens, personal communication, 03 March, 2012).
15
Pam Moore, personal communication on March 10, 2012.
16
What remained of the old stagecoach station was demolished in the 1990s
during the original development of what eventually became the Maderas Golf Club
(as told by Jeanen Monteleone, on 03 March 2012).
17
Letter by Robert Manis, Director of Development Services, City of Poway, to Tom Story, of Sunroad Enterprises,
dated October 12, 2009.
18
Letter by Penny Riley, Poway City Manager, to Tom Story, of Sunroad Enterprises,
dated August 11, 2011.
19
Frank Vaplon, personal communication on April 17, 2012.
20
With 13 inches of mean annual precipitation, 1 inch of mean annual runoff, and 54.2 inches of turf potential evapotranspiration:
21
Letter from Randall L. Hurlburt, Director (Acting) of Environmental Planning, to Gil West, Environmental Analysis Division,
Interdepartmental correspondence,
County of San Diego, California, dated August 25, 1976 (courtesy of Ms. Jeanen
Monteleone).
22
The California Water Atlas
indicates that mean annual runoff at Thompson Creek is about 0.8 inches, which
amounts to 6% of precipitation.
Yet U.S. Geological Survey
measurements in San Mateo Creek, a watershed in northern San Diego County, for example,
indicate that mean annual runoff in inland basins may be higher; in the case of San Mateo Creek,
close to 15% (Luis Parra, personal communication).
23
The word "riparian" is derived from the Latin ripa, meaning river bank.
Riparian is also the proper nomenclature for one of the fifteen terrestrial biomes of the Earth.
24
The vadose zone is the portion of Earth between the land surface and
the top of the phreatic zone, i.e., the position at which the groundwater
is at atmospheric pressure.
25
The Holocene is a geologic epoch which began at the end of the Pleistocene (11,700 years ago) and continues
to the present time.
26
Robert Myers, personal interview conducted on March 3, 2012.
27
A flowing artesian well is a well where the water level reaches the ground surface if the natural water pressure is high enough.
28
Jeanen Monteleone, personal communication, on April 24, 2012.
29
Paul Kassel, personal interview conducted on March 17, 2012.
30
Tom Moore, personal interview conducted on April 15, 2012.
31
A cord is the amount of wood that, when "ranked and well stowed"
(arranged so pieces are aligned, parallel, touching and compact),
occupies a volume of 128 cubic feet.
This corresponds to a well stacked woodpile 4 feet wide, 4 feet high, and 8 feet long;
or any other arrangement of linear measurements that yields the same volume (Wikipedia).
32 Every material has a dielectric constant k.
This constant has a minimum value of 1. Vacuum has k = 1; water has k = 80.
The larger the value of k, the greater the electric charge that can be stored or conducted. Thus, water is a universal solvent for ionic substances.
33
The solubility of a solute such as sodium chloride in a
solvent such as water is measured as the saturation concentration of the solution,
that is, the concentration at which the addition of more solute
does not increase the concentration of the solution. The solubility
of sodium chloride in water at 25 oC is 360 g of NaCl per 1000 g of H2O, the highest
among known solvents.
34
pH is the hydrogen [properly, hydronium ion] concentration in a solution. pE is the redox potential, which measures
the electron concentration in a solution.
35
The cycle of metamorphism, with depth and age, of groundwater geochemistry in the upper crust of the litosphere
is referred to as the Chebotarev sequence (Freeze and Cherry, 1979). Chebotarev (1955)
examined the data from 3364 bores collected practically from all continents and carried out 9719 chemical analyses
of groundwaters.
36
Bicarbonate waters may contain up to 3.8% salinity, sulfate waters up to 1.9%, and chloride waters up to 35.4%
(Chebotarev, 1955). By comparison, good potable water has 0.03% salinity.
37
Bioturbation is the physical rearrangement of the soil profile by soil life.
Burrowing animals and insects,
and plant root systems create passageways for air and water movement, changing soil morphology.
38
Precise measurements in two California soils showed salt increases of 3 to 5 meq/liter attributable solely to weathering.
This amounts to approximately 180 to 300 mg/liter (Rhoades et al., 1968).
39
A dS/m [deciSiemens per meter] is a measure of the electrical conductivity of water.
1 dS/m is approximately equal to 640 mg/liter (Salinity Management Guide, 2007).
40
No salinity data is currently available for Thompson Creek or Maderas. The values shown are best estimates.
For reference purposes, Mr. Paul Kassel, an Old Coach resident, had his well water tested on February 18, 2012.
The dissolved solids concentration was 588.62 milligrams/liter (equivalent to parts per million) (Paul Kassel, personnal comunication, March 17, 2012).
41
For example, in 2006, Tom Carter paid about $20,000
to deepen his well from 900 to 1200 feet.
In 2010, Frank Vaplon paid about $20,000 to redrill his well and deepen it from 280 to 610 feet.
42
The 280-feet maximum depletion measurement, based on the three wells with the longest and most reliable record, may not be the deepest
groundwater level at Thompson Creek. Paul Kassel reports that he is currently [April 16, 2012] having trouble pumping water from his well, even though the pump is located
at a depth of 650 feet from the surface. Two pumps burned out within a week.
43
In a fractured rock aquifer, detailed groundwater flow orientations cannot be constructed from the water table contours
due to the highly anisotropic nature of the geological medium (see, for instance, page 12 in Love et al., 2001).
44
Jerry Gill and Frank Vaplon have measured the static water level in up to seven (7) wells in Old Coach Estates
since January 1, 2011. The measurements have received tacit approval from Matt Wiedlin, a hydrologist retained by the
City of Poway.
REFERENCES
American Geological Institute. 1997. Glossary of Geology. Julia A. Jackson, editor, Alexandria, Virginia.
Alley, W. M., T. E. Reilly, and. O. E. Franke. 1999. Sustainability of groundwater resources.
U.S. Geological Survey Circular 1186, Denver, Colorado, 79 p.
Alley, W. M. 2003. Desalination
of Ground Water: Earth Science Perspectives. Fact Sheet 075-03, U.S. Geological Survey,
Denver, Colorado.
American Society of Civil Engineers. 1990. Agricultural salinity assessement and management.
Manuals and Reports on Engineering Practice No. 71, New York.
Bredehoeft, J. 1997. Safe yield and the water budget myth. Editorial, Ground Water, Vol. 35, No. 6, November-December, 929.
California Department of Water Resources. 2010.
Reference Evapotranspiration Zones. California Irrigation Management Information System (CIMIS).
Calleguas Municipal Water District. 2009.
Project brochures. Ventura County, California.
Chebotarev, I. I. 1955. Metamorphism of natural waters in the crust of weathering. Geochima et Cosmochimica Acta, 8, 22-48, 137-170, 198-212.
Don Howard Engineering. 2000. Hydrologic and biologic study of the Sycamore Creek sub-basin. July 28, 2000.
Famiglietti, J.S., M. Lo, S. L. Ho, J. Bethune, K. J. Anderson, T. Y. Syed, C. S. Swenson, C. R. De Linage, and M. Rodell. 2011. Satellites measure recent rates of groundwater depletion in California's Central Valley.
Geophysical Research Letters, Vol. 38, L03403, doi:10.1029/2010GL046442.
Freeze, R. A., and J. A. Cherry. 1979. Groundwater. Prentice-Hall, New Jersey.
Hardin, G. 1968. The Tragedy of the Commons. Science, Vol. 162, 1143-1148.
Hibbert, A.R. 1979. Managing vegetation to increase flow in the Colorado River Basin. USDA Forest Service General Technical Report RM-66, 27 p.
Hoffman, G. J., and M. Th. van Genuchten. 1983.
Water management for salinity control. Chapter 2C in Limitations to efficient water use in crop production, H. Taylor et al., eds., American Society
of Agronomy, 73-85.
Kazmann, R. G. 1956. "Safe yield" in ground water development: Reality or illusion? Journal of the Irrigation and Drainage Division, American Society of Civil Engineers, Vol. 82, No. IR3, November, Paper 1103.
Lee, C. H. 1915. The determination of safe yield of underground reservoirs of the closed-basin type. Transactions, American Society of Civil Engineers, Vol. LXXVIII, Paper No. 1315, 148-218.
Loucks, D. P. 2000. Sustainable water resources management. Water International, Vol. 25, No. 1, 3-10.
Love, A. J., P. G. Cook, G. A. Harrington, and C. T. Simmons. 2001. Groundwater flow in the Clare Valley. Department of Water Resources, Government of South Australia, Adelaide, Australia.
L'vovich, M. I. 1979. World water resources and their future. Translation of the original Russian edition (1974), American Geophysical Union, Washington, D.C.
Mass, E. V., and G. J. Hoffman. 1977. Crop salt tolerance: Current assessment. Journal of the Irrigation and Drainage Division, ASCE, Vol. 103, No. IR2, 115-134.
Meinzer, O. E. 1927. Plants as indicators of ground water. U.S. Geological Survey Water Supply Paper No. 577.
Maimone, M. 2004. Defining and managing sustainable yield.
Pillsbury, A. F. 1981. The salinity of rivers. Scientific American, Vol. 245, No. 1, July.
Nace, R. L.. 1960. Water management, agriculture, and groundwater supplies.
U.S. Geological Survey Circular 415, Washington, D.C., 12 p.
National Research Council. 2000. Investigating groundwater systems on regional and national scales.
Committee on USGS Water Resources Research, Water Science and Technology Board, Washington, D.C.
Ojos Negros Research Group. 2003. Sustainable
management of water in the Ojos Negros valley, Baja California,
Mexico. San Diego State University, Southwest Center for Environmental Research and Policy (SCERP).
Pavelko, M. T., D. B. Wood, y R. J. Laczniak. 2005. Las Vegas, Nevada: Gambling with water in the desert. In Part I, U.S. Geological Survey Circular 1182, por D. Galloway et al., 49-64.
Ponce, V. M. 1989. Engineering Hydrology: Principles and Practices. Prentice Hall, Upper Saddle River, New Jersey.
Ponce, V. M., R. P. Pandey, and S. Ercan. 2000.
Characterization of drought across climatic spectrum.
ASCE Journal of Hydrologic Engineering, Vol. 5, No. 2, April.
Ponce, V. M. 2005. The Salton Sea: An assessment. June.
Ponce, V. M. 2006. Groundwater utilization and sustainability. March.
Ponce, V. M. 2007. Sustainable yield of groundwater. May.
Ponce, V. M., and G. F. Player. 2008.
Some
facts about Sawyer Spring and Ash Creek surface-water/groundwater
interactions.
Pillsbury, A. F. 1981. The salinity of rivers. Scientific American, Vol. 245, No.1, July, 54-65.
Prudic, D. E., and M. E. Herman. 1996. Ground-water flow and simulated effects of development in Paradise Valley, a basin tributary to the Humboldt River, in Humboldt County, Nevada. U.S. Geological Survey Professional Paper 1409-F.
Rhoades, J. D., D. B. Krueger, and M. J. Reed, 1968. The effect of soil-mineral weathering on the sodium hazard of irrigation waters.
Soil Science Society of America Proceedings, Vol. 32, 643-647.
Rhoades, J. D., J. D. Oster, R. D. Ingvalson, J. M. Tucker, and M. Clark. 1974. Minimizing the salt burdens of irrigation drainage waters.
Journal of Environmental Quality, Vol. 3, No. 4, 311-316.
Salinity Management Guide. 2008. Learn about salinity and water quality, in Salinity Management Guide.
Santa Ana Watershed Project Authority. 2010. Inland Empire Brine Line.
Scanlon, B. R., K. E. Keese, A. L. Flint, L. E. Flint, C. B. Gaye, W. M. Edmunds, and I. Simmers. 2006.
Global synthesis of groundwater recharge in semiarid and arid regions. Hydrological Processes, 20, 3335-3370.
SCS Engineers. 2010. Annual groundwater monitoring report: October 2009 through September 2010. November 17, 2010, Project No. 01203535.17.
SCS Engineers. 2012. Annual groundwater monitoring report: October 2010 through September 2011. March 16, 2012, Project No. 01203535.17.
Segall, P., E. H. McKee, S. J. Martel, and B D. Turrin. 1990. Late Cretaceous age of fractures in the Sierra Nevada batholith,
California. Geology, Vol. 18, 1248-1251.
Seward, P., Y. Xu, and L. Brendock. 2006. Sustainable groundwater use, the capture principle, and adaptive management. Water SA, Vol. 32, No. 4, October, 473-482.
Solley, W. B., R. R. Pierce, and H. A. Perlman. 1998.
Estimated use of water in the United States in 1995.
U.S. Geological Survey Circular 1200, Denver, Colorado, 71 p.
Sophocleous, M. 1997. Managing water resources systems: Why "safe yield"
is not sustainable. Editorial, Ground Water, Vol. 35, No. 4, July-August, 561.
Sophocleous, M. 2000. From safe yield to sustainable development of water resources - The Kansas experience. Journal of Hydrology,
Vol. 235, 27-43.
Theis, C. V. 1940. The source of water derived from wells: Essential factors controlling the response of an aquifer to development.
Civil Engineering, Vol 10, No. 5, May, 277-280.
University of Arizona. 2000. Converting reference evapotranspiration into turf water use. Turf Irrigation Management Series, No. 2, AZ1195.
U.S. Geological Survey. 1999. Geologic map of the Escondido 7.5' quadrangle, San Diego County, California.
van Schilfgaarde, J. 1990. "Irrigated agriculture: Is it sustainable?" Chapter 28 in
ASCE Manuals and Reports on Engineering Practice 71, 584-594.
Walton, W. C. 1970. Groundwater resource evaluation. McGraw-Hill, New York.
Webb, R. H., and S. A. Leake. 2006.
Ground-water surface-water interactions and long-term change in riverine riparian
vegetation in the southwestern United States. Journal of Hydrology, Vol.
320, 302-323.
Webb, R. H., S. A. Leake, and R. M. Turner. 2007.
The ribbon of green: Change in riparian vegetation in the Southestern United States.
The University of Arizona Press, Tucson, Arizona.
World Commission on Environment and Development (The Brundtland Commission). 1987. Our Common Future. The United Nations, New York.
World Water Balance and Water Resources of the Earth. 1978.
U.S.S.R. Committee for the International Hydrological Decade, UNESCO, Paris, France.
 About the author About the author
Dr. Victor M. Ponce has taught hydrology at San Diego State University since 1980. He has close to forty years of experience in the water resources field. His extensive record of research and practice may be viewed at ponce.sdsu.edu |
| thompson.sdsu.edu |
|
120507 |